Microsoft Project Features: A Complete Guide to All MS Project Capabilities
The Microsoft Project features covered in this guide include task management, Gantt charts, resource allocation, earned value tracking, reporting, and Microsoft 365 integration — everything a project manager or business analyst needs to plan and deliver projects effectively.
| Key Facts | Details |
|---|---|
| Full product name | Microsoft Project (also known as MS Project or MSP) |
| Publisher | Microsoft Corporation |
| Desktop editions | Project Standard 2021 (individual PM), Project Professional 2021 (enterprise + Project Server) |
| Cloud plans | Project Plan 1 — web viewer | Project Plan 3 — full desktop + cloud | Project Plan 5 — portfolio management |
| File format | MPP (Microsoft Project file) — proprietary binary format |
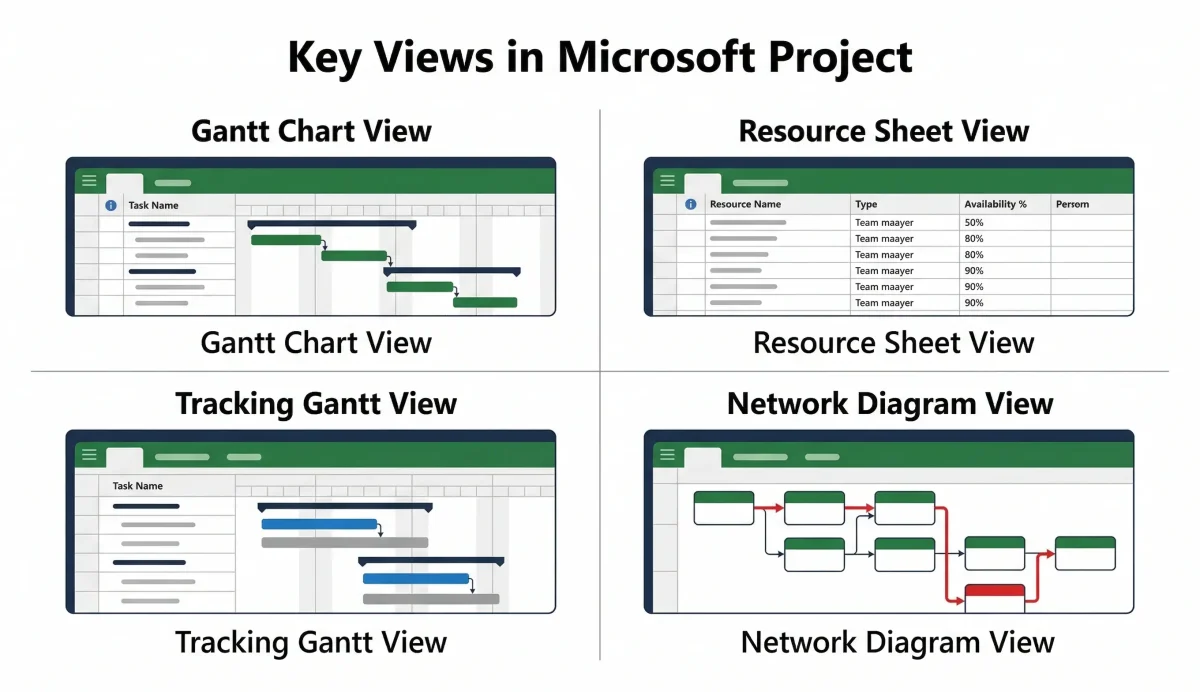
| Core views | Gantt Chart, Network Diagram, Resource Sheet, Resource Usage, Task Usage, Calendar, Timeline |
| AI integration | Microsoft Copilot (Plan 3 + Plan 5 with M365 Copilot licence) |
| Related page | For why these features matter, see: Benefits of using MS Project |
| Last updated | March 2026 |
The Microsoft Project features covered in this guide include task management, Gantt charts, resource allocation, earned value tracking, reporting, and Microsoft 365 integration — everything a project manager or business analyst needs to plan and deliver projects effectively.
If you are looking for an overview of why MS Project is valuable — the business benefits, pros and cons, pricing, and who should use it — see our companion guide: 10 Key Benefits of Microsoft Project. This article focuses exclusively on how each feature technically works and how to configure it.
In This Article
Microsoft Project Key Features — Core Scheduling Capabilities
Microsoft Project’s scheduling engine is the technical core of everything else. Before configuring any feature, the project manager must understand how MS Project calculates schedules, what each view shows, and how changing one element ripples through the rest of the plan.
1. Task Management — Configuration and Setup
MS Project structures all project work as tasks within a hierarchy called the Work Breakdown Structure (WBS). Understanding how to build and configure tasks correctly is the technical foundation of every MS Project schedule.
Task Types — How MS Project Recalculates Schedules
Every task in MS Project has a task type that controls how the scheduling engine responds when you change duration, work, or resource assignments. This is one of the most misunderstood settings in MS Project and the most common cause of unexpected schedule changes.
| Task Type | What It Controls | When to Use |
|---|---|---|
| Fixed Units (default) | When you change duration, MS Project recalculates Work. Resource units stay fixed. | Most tasks where resource availability drives the schedule. |
| Fixed Duration | When you change resources or work, duration stays locked. MS Project adjusts work. | Tasks with deadline-driven timelines regardless of resource availability. |
| Fixed Work | Duration adjusts when you add resources. Total work hours stay constant. | Tasks where total effort is fixed — adding resources shortens the schedule. |
Setting Task Dependencies and Lead/Lag
Task dependencies define the sequence in which tasks must happen. MS Project supports four dependency types, each with optional lead time (starting before the predecessor finishes) or lag time (a delay after the predecessor finishes).
| Dependency | Meaning | Example Use Case |
|---|---|---|
| Finish-to-Start (FS) | Task B cannot start until Task A finishes | Requirements must be complete before design begins |
| Start-to-Start (SS) | Task B cannot start until Task A starts | Testing can begin when development begins — parallel tracks |
| Finish-to-Finish (FF) | Task B cannot finish until Task A finishes | Documentation must finish when the feature it documents finishes |
| Start-to-Finish (SF) | Task B cannot finish until Task A starts | Rare — legacy system stays active until new system launches |
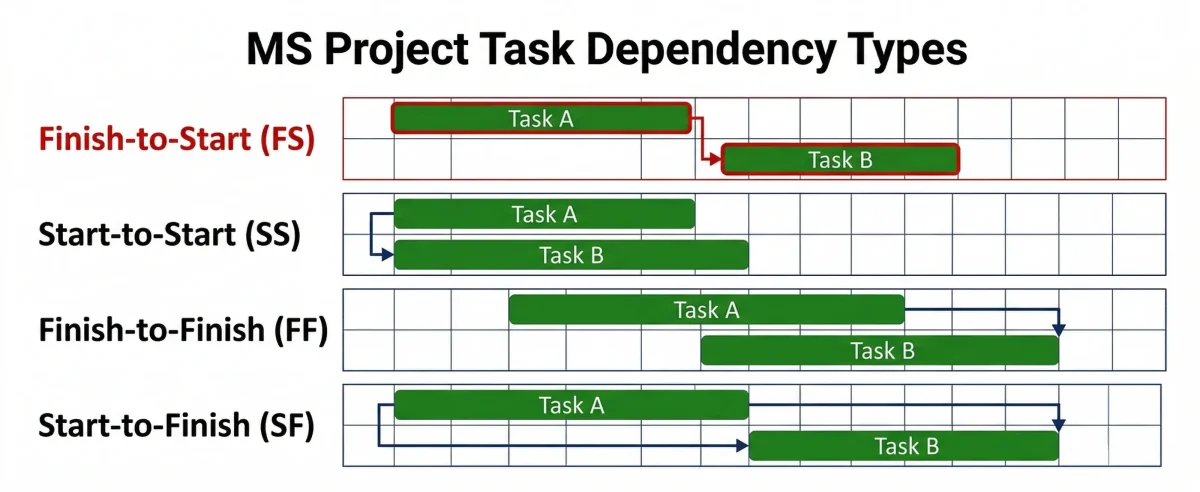
Lead and lag: Add lead or lag to any dependency by double-clicking the dependency line in the Gantt chart or editing the Predecessors field. Enter a negative number for lead time (e.g., -2d means Task B starts 2 days before Task A finishes) and a positive number for lag (e.g., 3d means Task B starts 3 days after Task A finishes). Lead time is one of the most powerful scheduling techniques for compressing project timelines.
Critical Path — How to Find and Display It
The critical path is the longest sequence of dependent tasks that determines the minimum project duration. Any delay on the critical path delays the project end date. MS Project calculates the critical path automatically based on task dependencies, durations, and constraints.
To display the critical path: Format tab → Bar Styles → check ‘Critical’ → critical tasks appear in red. Alternatively, use the Network Diagram view (View tab → Network Diagram) to see the full dependency network with critical path highlighted. To show total float for each task, add the ‘Total Slack’ column to the Gantt chart — tasks with zero total slack are on the critical path.
- Related: For how BAs use task breakdown in requirements tracing, see our business analyst best practices guide
2. Gantt Chart — Configuration and Views
The Gantt chart is MS Project’s default view and the one most stakeholders interact with. Knowing how to configure it precisely is essential for producing professional project schedules.
Adding Columns and Customising the Task Table
The left panel of the Gantt chart is a table that can display any task field. To add a column: right-click any column header and select Insert Column, then choose the field from the dropdown. Useful columns to add beyond the default set: Baseline Start, Baseline Finish, Total Slack, Cost, % Complete, Resource Names, and Predecessors.
To create a custom text column for tracking additional information (such as a requirements reference number): Insert Column → select Text1, Text2, etc. → right-click the column header → Field Settings → rename to ‘Requirements Ref’ or any label. Custom text fields persist in the MPP file and can be used in filters and reports.
Setting the Timescale and Non-Working Time
Double-click the timescale at the top of the Gantt chart to open the Timescale dialog. Set the top tier (months/quarters), middle tier (weeks), and bottom tier (days) independently. For long programmes, set the middle tier to months and hide the bottom tier. For sprint-level scheduling, show all three tiers with the bottom tier at days or hours.
Non-working time (weekends, public holidays) appears as grey shading on the Gantt chart and is controlled by the project calendar. To modify the base calendar: Project tab → Change Working Time. Add exceptions for company holidays. Assign different calendars to specific resources or tasks where needed.
Tracking Gantt — Displaying Baseline vs Actual
Once a baseline is set (Project tab → Set Baseline → Set Baseline), switch to the Tracking Gantt view (View tab → Other Views → Tracking Gantt). Each task shows two bars: the baseline bar (grey, below) and the current schedule bar (blue or red, above). Red bars indicate the task is on the critical path. If a task has slipped, the current bar extends beyond the baseline bar — the gap is visually proportional to the delay.
For BAs: The Tracking Gantt is the standard view for requirements delivery milestone reviews. Add the Baseline Finish and Finish Variance columns to the task table to show stakeholders exactly which deliverables are on schedule and which have slipped, and by how many days. This replaces manual status report preparation.
3. Resource Allocation — Technical Setup
Resource management in MS Project begins with the Resource Sheet (View tab → Resource Sheet). Each row represents one resource. The key fields to configure correctly at setup are: Type (Work, Material, or Cost), Max Units (maximum availability as a percentage — 100% = one full-time person, 50% = half-time), Standard Rate, Overtime Rate, and Base Calendar.
Resource Types and When to Use Each
| Resource Type | What It Tracks | Example |
|---|---|---|
| Work | Hours of effort — drives schedule calculation. Over-allocation alerts fire on work resources. | Developer, BA, Tester, Project Manager |
| Material | Quantity consumed — does not drive schedule. Tracks consumption of physical items. | Concrete (tonnes), Licences (units), Server hardware |
| Cost | A fixed cost applied to a task regardless of duration or units. Does not affect schedule. | Travel expenses, Vendor fees, Insurance premiums |
Cost Rate Tables — Setting Standard, Overtime, and Per-Use Rates
Double-click any Work resource in the Resource Sheet to open the Resource Information dialog. The Costs tab shows Cost Rate Table A (the default). Each table has columns for Effective Date, Standard Rate, Overtime Rate, and Per Use Cost. Add multiple rows to show rate changes over time — MS Project applies the rate in effect on each task’s start date automatically.
Cost Rate Tables B through E allow different rates for different types of work by the same resource. For example, a consultant may charge a standard rate for development work (Table A) and a higher rate for facilitation work (Table B). Assign the appropriate table in the Assignment Information dialog when assigning the resource to each task.
Resource Levelling — Settings and Options
When resources are over-allocated (shown in red in the Resource Sheet and Resource Usage view), MS Project’s levelling feature resolves conflicts by delaying or splitting tasks. Access levelling settings via Resource tab → Level All, or Resource tab → Leveling Options for fine-grained control.
Key levelling settings: Levelling order (Standard, ID Only, or Priority/Standard) — Standard uses slack, free float, dependencies, and priority to determine which tasks to delay. Levelling can create splits: MS Project breaks a task into two segments with a gap between them. Check ‘Levelling can split remaining work’ only if your methodology accepts split tasks. Review the Levelling Gantt view (View → Other Views → Leveling Gantt) after levelling to see which tasks were moved and by how much.
- Related: For BAs preparing for CBAP certification, earned value management is a tested knowledge area.
4. Project Tracking — Baselines, Actuals, and Variance
Setting the baseline (Project tab → Set Baseline) saves a snapshot of the current plan — start dates, finish dates, duration, work, and cost — into the Baseline fields (Baseline Start, Baseline Finish, Baseline Work, Baseline Cost). Once the baseline is set, these fields never change unless you deliberately reset the baseline.
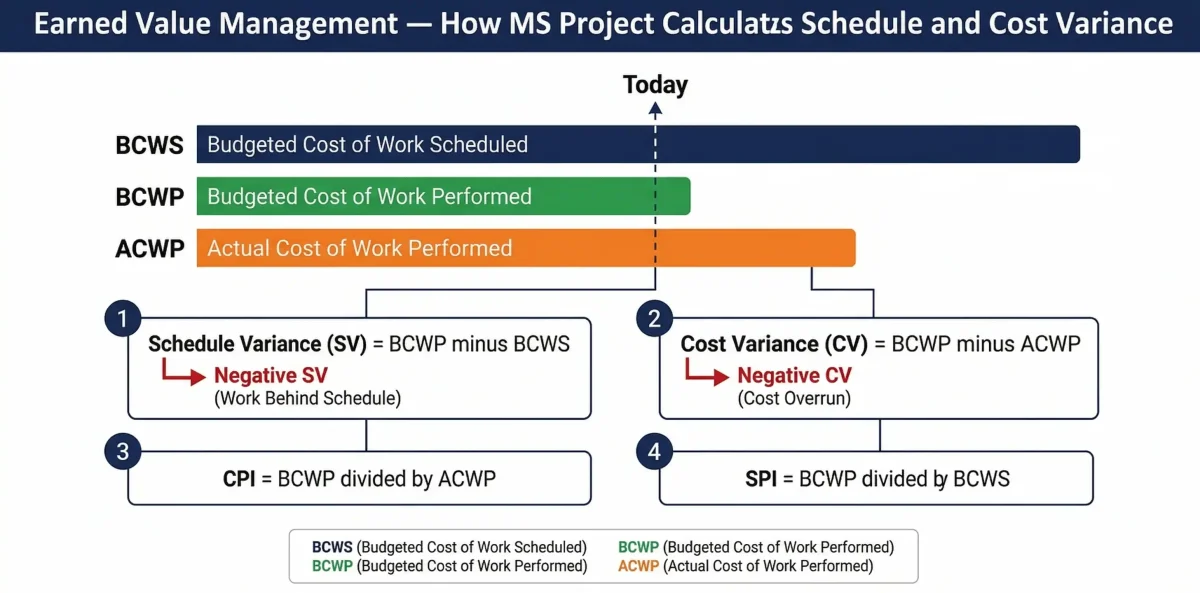
Entering Actuals and Reading Variance
Enter actuals via the Tracking toolbar or the Update Tasks dialog (Task tab → Mark on Track dropdown → Update Tasks). For each completed or in-progress task, enter Actual Start, Actual Finish (if complete), % Complete, and Actual Work. MS Project then populates the variance fields automatically.
| Field | Formula | What It Tells You |
|---|---|---|
| Schedule Variance (SV) | SV = BCWP minus BCWS | Negative = behind schedule. Positive = ahead. |
| Cost Variance (CV) | CV = BCWP minus ACWP | Negative = over budget. Positive = under budget. |
| Cost Performance Index (CPI) | CPI = BCWP divided by ACWP | Below 1.0 = spending more than planned per unit of work. |
| Schedule Performance Index (SPI) | SPI = BCWP divided by BCWS | Below 1.0 = completing less work than planned per time period. |
| Estimate at Completion (EAC) | EAC = BAC divided by CPI | Projected final cost based on current spending efficiency. |
Setting Up Traffic Light Indicators
MS Project does not have built-in traffic light columns, but they are easy to add using custom flag or indicator fields. Insert a new column → select Indicator1 or use a Graphical Indicator format on any number field. Right-click the column header → Field Settings → Graphical Indicators. Set threshold values: CPI below 0.9 = red, 0.9 to 1.0 = amber, above 1.0 = green. The indicator appears as a coloured icon in the column automatically.
5. Reporting — Technical Setup and Customisation
MS Project’s built-in reports are accessed via Report tab → View Reports. Reports are grouped into five categories: Dashboards, Resources, Costs, In Progress, and Getting Started. Each report opens as a visual page with charts and tables that pull live data from the project file.
Customising a Built-In Report
Click any element in a report to select it — charts, tables, and text boxes are all individually editable. Right-click a chart and select Edit Data to change which fields are displayed and how they are grouped. Use the Report Tools Design tab to change chart types, apply themes, add shapes, and insert images such as company logos. Reports created this way are saved inside the MPP file and are available every time the file is opened.
Connecting MS Project to Power BI via OData
Project Online (Plan 3 and Plan 5) supports OData feeds that Power BI can connect to directly. In Power BI Desktop: Get Data → OData Feed → enter your Project Online OData URL (format: https://[yourtenant].sharepoint.com/sites/pwa/_api/ProjectData/). Select the tables you need (Tasks, Resources, Assignments, Projects) and load them into Power BI.
This connection is live — refreshing the Power BI report pulls current data from Project Online. For PMOs managing multiple projects, this enables portfolio-level dashboards that consolidate schedule, cost, and resource data from all active projects in one view. Desktop MS Project (non-cloud) can export to Excel as an intermediate step for Power BI connection.
- Related: Follow our guide on Introduction to Power BI
6. Team Collaboration — Technical Setup
Adding an MS Project plan as a tab in Microsoft Teams requires Project for the Web or Project Online (not desktop MS Project). In the Teams channel: click the + tab icon → search for ‘Project’ → select the Project app → choose the project to display. Team members with at least a Project Plan 1 licence can view the schedule and update their assigned tasks directly in Teams.
SharePoint Integration — Linking Documents to Tasks
In Project Online, each project automatically gets a SharePoint team site at the URL: https://[tenant].sharepoint.com/sites/[projectname]. Store project documents, risk registers, issue logs, and meeting minutes in this site’s document library. To link a specific document to a task in MS Project: in the Task Information dialog → Notes tab → Insert Object → Link to File → navigate to the SharePoint document URL. The link appears as a clickable attachment in the Gantt chart.
Permission Levels in Project Online
| Permission Level | What the User Can Do | Minimum Licence Required |
|---|---|---|
| Project Manager | Full create, edit, publish, and delete rights on their own projects | Project Plan 3 |
| Team Member | View assigned tasks, update % complete, submit timesheets | Project Plan 1 |
| Portfolio Viewer | Read-only access to all projects in the portfolio | Project Plan 1 |
| Portfolio Manager | Create and edit programmes, manage resource pool, approve timesheets | Project Plan 5 |
| Administrator | Manage server settings, enterprise calendars, and security groups | Project Plan 5 + SharePoint admin |
Need hands-on Microsoft Project training?
Techcanvass offers Microsoft Project training courses covering scheduling, resource management, tracking, and reporting — designed for Project Managers and Business Analysts working on real projects.
Advanced Microsoft Project Features
7. Microsoft 365 Integration — Technical Connections
MS Project’s integration with the Microsoft 365 ecosystem operates at multiple technical levels. Understanding which integrations are available in which plan tier prevents common configuration errors.
| Integration | Available In | What It Does |
|---|---|---|
| Microsoft Teams tab | Project for the Web, Project Online | Add project as a Teams tab. Team members view and update tasks in Teams. |
| SharePoint team site | Project Online (auto-created per project) | Dedicated document library and site for each project. |
| Power BI OData | Project Online Plan 3+ | Live data connection for portfolio dashboards. |
| Outlook task sync | Project Professional (desktop) | Task deadlines appear in assignee Outlook calendars. |
| Excel import/export | All versions | Import task lists from Excel; export project data to Excel for offline analysis. |
| Power Automate | Project for the Web | Build no-code workflows: approval routing, status notifications, Teams alerts. |
| Microsoft Copilot | Project Plan 3/5 + M365 Copilot licence | Natural language queries against project data. |
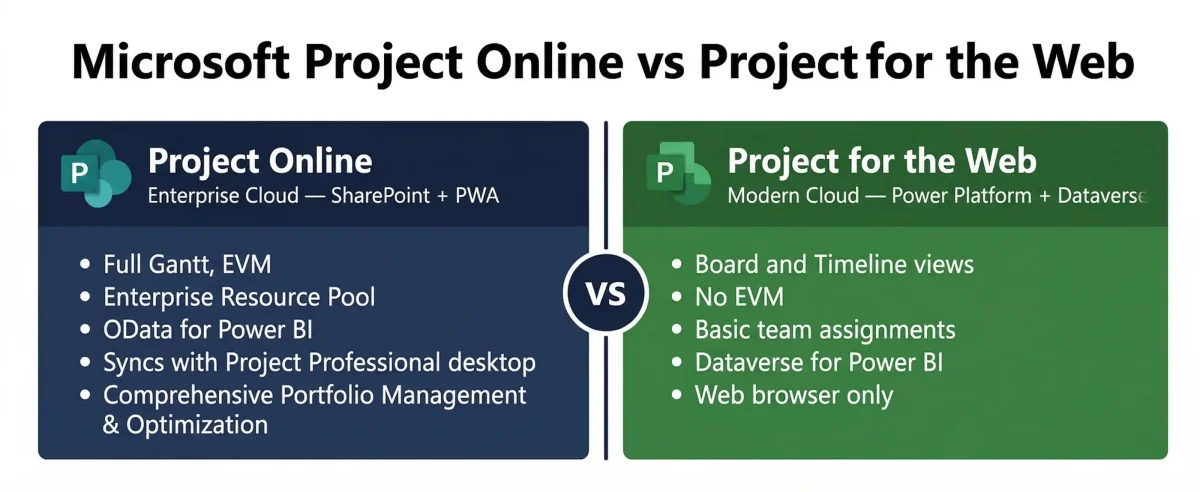
8. Microsoft Project Online vs Project for the Web — Technical Comparison
These two cloud products are frequently confused. They have different technical architectures, different feature sets, and different Microsoft 365 integration depths.
| Dimension | Project Online | Project for the Web |
|---|---|---|
| Architecture | Built on SharePoint — uses Project Web App (PWA) | Built on Microsoft Power Platform (Dataverse) |
| Gantt Chart | Full Gantt with baseline, tracking, critical path | Timeline view only — no baseline or EVM |
| Resource Management | Enterprise resource pool, levelling, EVM | Basic team member assignment, workload view |
| Earned Value Analysis | Full BCWS/BCWP/ACWP/CPI/SPI | Not supported |
| Portfolio Management | Full portfolio — demand management, capacity planning | Basic roadmap view |
| Copilot Integration | Yes (Plan 3+) | Yes |
| Power BI Connection | OData feed (direct, live) | Dataverse connector in Power BI |
| Offline/Desktop | Syncs with Project Professional desktop client | Web only |
| Best For | Enterprise PMO, complex multi-resource programmes | Lightweight team scheduling, simple projects |
- For official plan pricing and feature comparison, see the Microsoft Project plans page.
9. AI and Copilot Features in Microsoft Project
Microsoft Copilot is available in Project Plan 3 and Plan 5 for subscribers who also have a Microsoft 365 Copilot licence. Copilot in MS Project is accessed through the Copilot pane, which opens as a side panel within Project Online or Project for the Web.
What Copilot Can Do in MS Project
| Copilot Capability | How to Trigger It | Output |
|---|---|---|
| Project status summary | Ask: ‘Summarise the current project status’ | Plain-language paragraph covering schedule health, overdue tasks, and critical path status. |
| Risk identification | Ask: ‘What are the top schedule risks this week?’ | Bulleted list of at-risk tasks with variance data and suggested actions. |
| Task creation from description | Ask: ‘Create a task list for a software UAT phase’ | Draft task list with suggested durations inserted into the project grid. |
| Resource conflict detection | Ask: ‘Which resources are over-allocated this month?’ | Summary of over-allocated resources with affected tasks listed. |
| Status report generation | Ask: ‘Write a status update for the steering committee’ | Draft narrative status report based on current schedule data. |
For BAs: Copilot’s status summary capability reduces one of the most time-consuming BA tasks — translating Gantt chart variance data into a readable stakeholder narrative. A BA managing requirements delivery timelines can generate a draft status report in seconds rather than spending 30-45 minutes manually extracting and writing it.
10. Advanced Views, Custom Fields, and the MPP File Format
MS Project includes over 25 built-in views. The ones most useful beyond the default Gantt chart are: Network Diagram (shows the full dependency graph — useful for identifying loops and visualising critical path logic), Resource Usage (shows hours per resource per day across all tasks — the key view for workload analysis), Task Usage (shows hours per task per resource per day — useful for checking individual assignment loads), and Team Planner (drag-and-drop visual resource assignment — Project Professional only).
Custom fields allow project managers to capture additional data not in the default field set. Insert a new column → choose from Number1-20, Text1-30, Date1-10, Flag1-20, Duration1-10, or Cost1-10 fields. Custom fields can have: a renamed label (right-click header → Field Settings), a formula (calculates a value from other fields), or a lookup table (a defined list of valid values). Custom fields are one of the most powerful but least used features in MS Project — they enable project-specific tracking without any programming.
The MPP file format is a proprietary binary format. MPP files can only be opened natively by MS Project. To share with stakeholders who do not have MS Project: File → Export → Save Project as File → select PDF (exports a visual snapshot), Excel Workbook (exports task/resource data as tables), or XML (for interoperability with other PM tools). The XML export is the most complete representation of the project data and can be imported by Project Libre and other open-source alternatives.
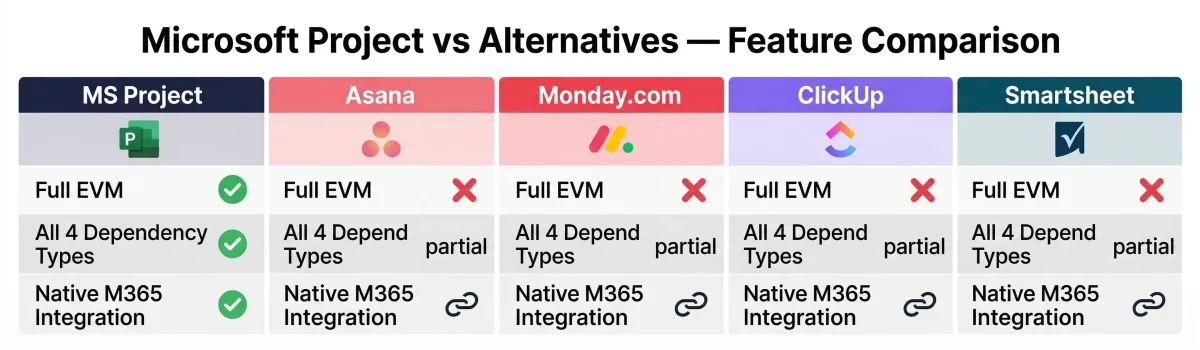
Microsoft Project vs Alternatives — Feature Comparison
Microsoft Project is built for scheduling complexity that lighter tools cannot handle. Here is a precise technical comparison against the four most commonly evaluated alternatives:
| Feature / Capability | MS Project | Asana | Monday.com | ClickUp | Smartsheet |
|---|---|---|---|---|---|
| Gantt Chart Type | Advanced — critical path, baseline overlay, tracking Gantt | Basic timeline | Basic timeline | Basic Gantt view | Grid-based Gantt |
| Task Dependency Types | All 4: FS, SS, FF, SF + lead/lag | FS only | FS only | FS, SS, FF | FS, SS, FF, SF |
| Critical Path Calculation | Automatic — highlights in red | No | No | Manual flag only | No |
| Resource Cost Rate Tables | 5 rate tables per resource + overtime | No | No | No | Basic cost tracking |
| Earned Value Analysis (EVM) | Full: BCWS, BCWP, ACWP, CPI, SPI, EAC | No | No | No | No |
| Baseline Comparison | Baseline vs Actual visual overlay | No | No | No | Snapshot comparison |
| Custom Fields | 20 text + 20 number + 10 date + 10 cost + 10 duration | Custom fields | Custom fields | Custom fields | Custom columns |
| MPP/XML File Export | Native MPP, XML, Excel, PDF | CSV, PDF | Excel, PDF | CSV, Excel | Excel, PDF |
| Portfolio Management | Project Online Plan 5 — full enterprise | Portfolio dashboards | Portfolio view | Portfolios | Portfolio view |
| Microsoft 365 Native | Yes — Teams, SharePoint, Power BI, Outlook, Power Automate | Via connector | Via connector | Via connector | Via connector |
| Copilot AI | Yes (Plan 3+ with M365 Copilot) | Limited AI features | Monday AI | ClickUp AI | No |
The technical differentiator is scheduling depth. MS Project is the only tool in this table with all four dependency types, automatic critical path, full EVM, and native Microsoft 365 integration. For enterprise project environments requiring PRINCE2, PMI, or BABOK-aligned governance, no alternative tool provides equivalent functionality at the scheduling layer.
Summary: Microsoft Project Features by Category
The following table summarises all features covered in this guide by category — useful as a quick reference when evaluating MS Project for a specific project need.
| Feature Category | Key Capabilities | Plan Required |
|---|---|---|
| Task Scheduling | WBS, task types (Fixed Units/Duration/Work), 4 dependency types + lead/lag, critical path, milestones, constraints | Standard / Professional / Any cloud plan |
| Gantt Chart | Full customisation, baseline overlay, Tracking Gantt, timescale control, critical path formatting, Network Diagram view | Standard / Professional / Any cloud plan |
| Resource Management | Work/Material/Cost resources, 5 cost rate tables, availability calendars, over-allocation alerts, automatic levelling | Standard / Professional / Any cloud plan |
| Earned Value Management | Baseline setting, BCWS/BCWP/ACWP calculation, CPI/SPI/EAC fields, graphical indicators | Standard / Professional / Any cloud plan |
| Reporting | 5 built-in report categories, full visual customisation, Power BI OData connection | Cloud: Plan 3+ for OData |
| Collaboration | Teams tab integration, SharePoint team site, permission management, team member task updates | Project Online Plan 1+ for team members |
| Advanced Views | Team Planner, Resource Usage, Task Usage, 25+ built-in views | Professional for Team Planner; Standard for others |
| Custom Fields | 20 text, 20 number, 10 date, 10 cost, 10 duration fields with formulas and lookup tables | All versions |
| AI / Copilot | Natural language queries, status summaries, risk identification, task generation | Plan 3+ with M365 Copilot add-on |
| Portfolio Management | Demand management, capacity planning, enterprise resource pool, portfolio dashboards | Project Online Plan 5 |
For the business case behind these features — ROI, governance benefits, stakeholder value, and who should use MS Project — see our companion guide: 10 Key Benefits of Microsoft Project.
Frequently Asked Questions: Microsoft Project Features
To set a baseline in MS Project, go to Project tab → Set Baseline → Set Baseline. In the dialog, select ‘Baseline’ (the primary baseline — up to 10 baselines are available) and choose whether to set it for the entire project or for selected tasks only. Click OK.
Once set, the Baseline Start, Baseline Finish, Baseline Work, and Baseline Cost fields are populated. To view the baseline overlay, switch to Tracking Gantt view (View tab → Other Views → Tracking Gantt) where baseline bars appear in grey below the current schedule bars.
To display the critical path in MS Project: go to Format tab → Bar Styles group → check ‘Critical Tasks’. Critical path tasks appear in red in the Gantt chart. Alternatively, use the Gantt Chart Wizard (Format tab) to walk through display options.
To show which tasks have float, add the ‘Total Slack’ column. Tasks with zero total slack are on the critical path. To see the full dependency network visually, switch to Network Diagram view (View tab) — critical path tasks appear with a red border.
Resource levelling resolves over-allocation by delaying or splitting tasks so no resource is assigned more work than their available capacity. To run levelling: Resource tab → Level All. Review ‘Leveling Options’ for more control.
Key settings include ‘Level only within available slack’ (keeps the end date fixed) and ‘Levelling can split remaining work’. After levelling, review the Leveling Gantt view to see moved tasks. Use ‘Clear Leveling’ to undo changes.
The standard Gantt Chart view shows the current schedule — tasks, dependencies, and progress bars. It shows one bar per task. The Tracking Gantt view shows two bars per task: the baseline bar (grey, positioned lower) and the current schedule bar (blue or red).
When a task has slipped, its current bar extends beyond the baseline bar — the visual gap represents the delay. Red bars indicate critical path tasks. This view is the standard tool for schedule status reporting in steering committee presentations.
For Project Online (Plan 3+): In Power BI Desktop, Get Data → OData Feed → enter your Project Online OData URL (https://[yourtenant].sharepoint.com/sites/pwa/_api/ProjectData/). Sign in and select tables like Projects, Tasks, and Resources.
For desktop MS Project (non-cloud): Export your project to Excel via File → Export → Save Project as File → Excel Workbook, then connect Power BI to that Excel file to build your reports.
MPP is Microsoft Project’s proprietary binary file format. It stores the complete project — tasks, resources, baselines, and calendars — in a single file. MPP files can only be opened natively by Microsoft Project.
To share with non-users: File → Export → choose PDF (visual snapshot), Excel Workbook (spreadsheet data), or XML (compatible with other tools). For Project Online, data can be shared via the Project Web App URL for browser access.
Right-click any column header → Insert Column → select from custom types like Text1-30, Number1-20, or Date1-10. Right-click the new header → Field Settings to rename it (e.g., rename Text1 to ‘Requirements Reference’).
To add logic: Project tab → Custom Fields → click Lookup to create a defined list, or Formula to calculate values automatically. Custom fields are saved inside the MPP file and available in all views and reports.
Project Standard includes the core scheduling engine, task/resource management, and standard reports. Project Professional adds connection to Project Server/Project Online for enterprise resource pools and portfolio management.
Professional also includes the Team Planner view (visual scheduling), enterprise project templates, SharePoint task sync, and Skype integration. Professional is required for any user connecting to Project Online Plan 3 or Plan 5.
Constraints restrict when a task can start or finish. By default, tasks have ‘As Soon As Possible’ constraints. To change: double-click a task → Advanced tab → Constraint Type. Options include Must Start On, Start No Earlier Than, and As Late As Possible.
Hard constraints (Must Start On/Finish On) can override dependency logic and create negative float, often causing schedule errors. Use them only when a task has an immovable external deadline.
Copilot in Project (for Plan 3/5 with M365 Copilot licence) provides a chat panel for natural language interaction. It can generate project status summaries, identify over-allocated resources, and create draft task lists from descriptions.
It also summarises schedule variance and drafts steering committee reports. Copilot suggests changes rather than modifying the plan autonomously, allowing the PM to review and apply updates manually.