Data is extremely important in today’s digital-first world. Organizations use insights from the data to make decisions. What helps them draw insights from the data? The Data Analytics process helps organizations make sense of data.
In this article, we take a deep dive into the data analytics lifecycle phases.
Data Analytics process steps
The Data Analytics lifecycle process is an evolutionary process and comprises seven phases or steps. Each phase has its significance and helps in moving to the next step.
The process starts with the understanding of the problem and defining the outcome or the result. Each subsequent phase helps develop the solution that will provide the desired result.
Case example 1
An organization would like to know the reasons for decreasing sales for a product. This is a problem that warrants analysis of historical data.
Case example 2
An FMCG company is trying to understand the expected revenue from a product line, which it would like to offer across the country. This will help them make a decision.
These are examples of problems that can be solved using data analytics initiatives.
Let’s see the steps of the data analytics process.
Step 1: Define the problem
“If I had an hour to solve a problem, I’d spend 55 minutes thinking about the problem and five minutes thinking about solutions.”
~ Albert Einstein
This quote from Albert Einstein highlights the importance of understanding the right problem to solve. Why such a big deal about the right problem?
The client is living with the problem, so they should be able to state that clearly. But that is far from the truth in many cases.
When you visit a doctor with a problem, you also explain to the doctor what is happening to you. For example, you are experiencing pain in the chest. Is that the problem? If you observe, the doctor asks you questions to investigate it further and may ask for tests. Why is that so?
Your chest pain is the symptom and not the real problem. The doctor tries to understand the reasons which could be acidity, heart problem, or something else. Unless the real problem is treated, your problem will not be solved.
Consider yourself as the client and the Doctor as the data analyst.
The first step is to ask questions and understand the root cause. You may need to use 5 whys or root cause analysis techniques for this.
Once the problem is identified, you need to identify the data needed to solve the problem.
Another example, in case example 2, you need to see the historical sales data and demographics data to predict the demand for the product across the country.
Step 2: Data Collection
The next step is to source the data for the initiative. The data can be sourced from a single database or multiple databases. Data can also be collected by conducting market research, interviews, and analysing research reports.
It is important that we get the data to a single database for the next phases.
in case example 2, the sales data and the demographics data will come from different sources. The sourced data will be put in a separate database for ease of use and other considerations.
Step 3: Data Cleaning
The next step is to make the data suitable for analysis. Data cleaning is an important phase and includes:
- Correcting the errors in data,
- Removing duplicates
- Removing inconsistencies
- Correcting wrongly formatted data
- Removing outliers
The analysis cannot produce correct results without clean data. Let’s see a couple of examples.
See the table below. The date format in Row 2 is incorrect. This needs to be corrected.
Sr. No | Date of Transaction | Order Number | Qty | Unit Price | Order Value |
1 | 19-Jan-2024 | P12569-2024 | 10 | 230 | 2300 |
2 | 24/Jan-2024 | P12969-2024 | 100 | 145 | 14500 |
3 | 5-May-2024 | P23450-2024 | 1 | 20 | 20 |
4 | 5-May-2024 | P23450-2024 | 1 | 20 | 20 |
5 | 09-05-2024 | P23490-2024 | 20 | 120 | 2400 |
Also, look at row number 3 and 4, this is a case of duplicate data. Without correcting these issues with data, it will not be wise to move to the next step.
Step 4: Data analysis
The next step is analyzing data, which is collected and cleaned. Analysis techniques are used based on the problem and the data. We may use mathematical, statistical, or machine learning techniques to discover patterns, relationships, trends, or predictions. Software applications/platforms like R, Python, and Excel are used for data analysis.
Checkout Our Data Analytics Course
Our Data Analytics certification training takes a hands-on and business-focused approach to help you learn all the nuisances of Data Analytics.
Step 5: Interpreting and visualizing the data
The next step is to discover – What does the data tell us? Visualizing the data plays an important part. We can create pie charts, bar charts, scatter charts, or any other form of visualization charts to discover patterns or trends.
The most common data visualization techniques are:
- Pie and stacked bar charts
- Line charts and Area charts
- Histograms
- Scatter plots
- Heat Maps
- Treemaps
Example
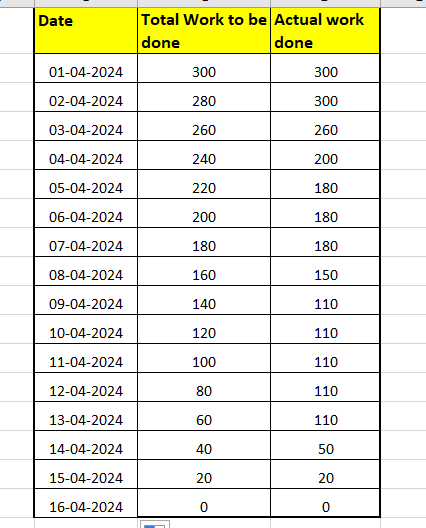
In an agile project, the team is managing the status of work in a tabular format:

The data table shows the progress for each day. For example, on 4th April 2024, the remaining work was 200 units. Comparing it with the total work to be done indicates that the team was doing better than expected.
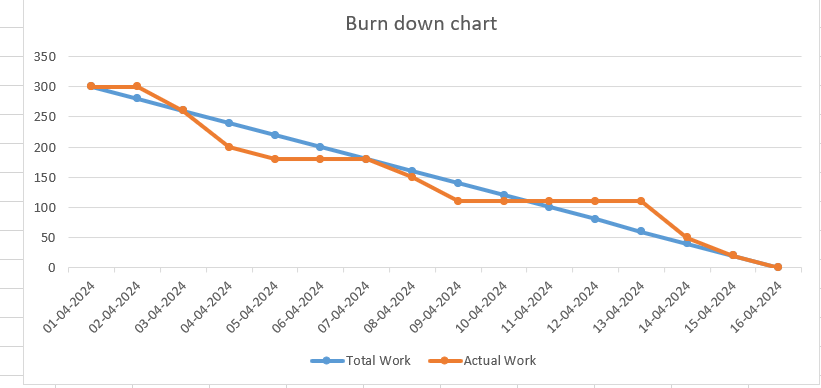
But if we present the same data using line charts, the trend or rate of work for the team becomes easy to understand and visualize, as shown below:

Data Analysts can use a data visualization tool to create these visual diagrams. The top tools are:
- Power BI
- Tableau
- Qlik
- Excel
Read Top Data visualization tools to know more about the tools and usage.
Step 6: Data storytelling
Communicating the insights to the stakeholders is extremely important. Stakeholders could be non-technical or may not be able to understand the technical jargon or terms at all. Presenting the data in such a form that all the stakeholders can make sense of it, is important.
Data storytelling is the process of transforming data insights into a relatable and understandable story so that it can be presented to the stakeholders.
How to tell a story with data? There are 3 elements of data storytelling:
- Build your narrative – Decide the story you want to share with the stakeholders. Use your data to back up your narrative.
- Use visual diagrams – Use the right visuals that enhance and support your story. Unless your storyline, data, and visuals don’t align, your story will not make an impact.
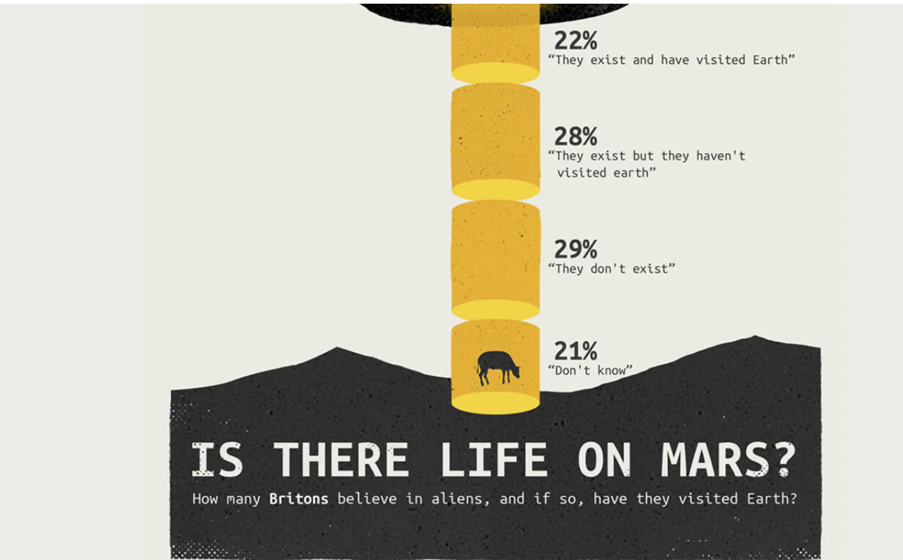
This is an example from 10 data storytelling examples. “Is there life on Mars” is an excellent example of using visualizations to support the story.

- Build the story for impact – The final element is to build the story. The context, the problem, the solution, and the benefit told in the right sequence and right focus will help you achieve what you would like to.
Step 7: Measuring effectiveness and improvement
The final step is to measure the effectiveness of the solution. Data is collected to check the actual outcomes vs the expected outcome. If the actual outcomes is worse than the expected outcomes, root cause analysis is conducted to find the gaps in the solution. This cycle will be continued till the expectations are met.
The data analytics initiative can continue to deliver value to the stakeholders. The last step may end the data analytics process if the outcome is achieved. Else it may continue till the outcome is achieved.
If you would like to know more about Data Analytics, you can read our Fundamentals of Data Analytics article.
Conclusion
In this article, we took a deep dive into the data analytics lifecycle phases. These steps help a data analyst or any AI/ML professional to help achieve the business objectives.


