Fundamentals of Data Analytics: Concepts, Types, and Tools
The fundamentals of data analytics, explained from first principles: the four types of analytics, the step-by-step process, core concepts, the tools professionals use, and how data analytics fits into a business analyst’s career.
In This Guide
What you will learn
What are the fundamentals of data analytics?
The fundamentals of data analytics cover how raw data is collected, cleaned, and analysed to produce insights that support decision making. The four core types are descriptive (what happened), diagnostic (why it happened), predictive (what will happen), and prescriptive analytics (what action to take). Common tools include SQL, Excel, Python, Tableau, and Power BI.
Data analytics is the practice of collecting, organising, and analysing data to identify patterns, trends, and relationships that inform decisions. It combines statistical methods, programming, and business knowledge to turn large volumes of raw data into actionable insights.
This guide covers what data analytics is, the four types, the step-by-step process, the tools used in practice, how it connects to a business analyst’s career, and the skills worth learning first. If you are new to the topic, this is the right place to start.
The four types of data analytics
Each type of data analytics answers a different question about your data. Understanding these four types is the foundation of all data analytics work, and most teams use them in this order, from simplest to most advanced.
Descriptive Analytics
Answers “what happened?” using historical data. For example, summarising last quarter’s sales transactions to check whether a 10% growth target was achieved. Uses summaries, charts, and pattern analysis.
Diagnostic Analytics
Answers “why did it happen?” by examining diverse datasets for patterns and correlations. A retailer might combine sales data, customer feedback, and campaign data to find why sales fell in a given month.
Predictive Analytics
Answers “what will happen?” using machine learning and statistical algorithms applied to past data. Used to forecast customer churn, demand for new products, or future revenue.
Prescriptive Analytics
Answers “what should be done?” by turning predictions into recommended actions, such as optimal pricing, inventory allocation, or marketing channel selection.
| Type | Question it Answers | Example | Difficulty |
|---|---|---|---|
| Descriptive | What happened? | A sales report showing total revenue by region for last quarter | Entry level |
| Diagnostic | Why did it happen? | Drilling into sales data to find a region underperformed due to a supply issue | Intermediate |
| Predictive | What will happen? | Using historical sales patterns to forecast next quarter’s revenue | Advanced |
| Prescriptive | What should be done? | Recommending optimal pricing based on demand forecasts and competitor data | Advanced |
Data analytics vs data analysis: what is the difference?
The terms are often used interchangeably, but they mean different things in professional practice. Data analysis is the process of examining a specific dataset to answer a specific question. It is typically a project-based activity with a defined start and end. Data analytics is the broader discipline that includes the tools, processes, and ongoing systems used to analyse data continuously across an organisation.
Every data analytics system involves data analysis, but not every data analysis task is part of a larger analytics system. A business analyst running a one-off churn report is doing data analysis. A company building a real-time customer behaviour monitoring platform is doing data analytics.
| Data Analysis | Data Analytics | |
|---|---|---|
| Scope | Examining a specific dataset to answer a specific question | The broader discipline: tools, processes, and systems for ongoing data examination |
| Timeframe | Usually a one-time or project-based activity | Ongoing and continuous |
| Output | A report, finding, or conclusion | A system of insights supporting regular decision making |
| Example | Analysing last month’s sales figures to find the best-selling product | Building a dashboard that tracks sales performance and flags anomalies in real time |
The data analytics process
Every data analytics project follows a similar process regardless of the tools or industry involved. Understanding this process helps you work systematically and produce more reliable results.
Define the question
Identify the business problem or decision the analysis needs to support, and the data needed to address it. Without a clear objective, the initiative will not be useful.
Collect data
Gather relevant data from internal databases, APIs, spreadsheets, surveys, or third-party sources, building on what was identified in step one.
Clean and prepare data
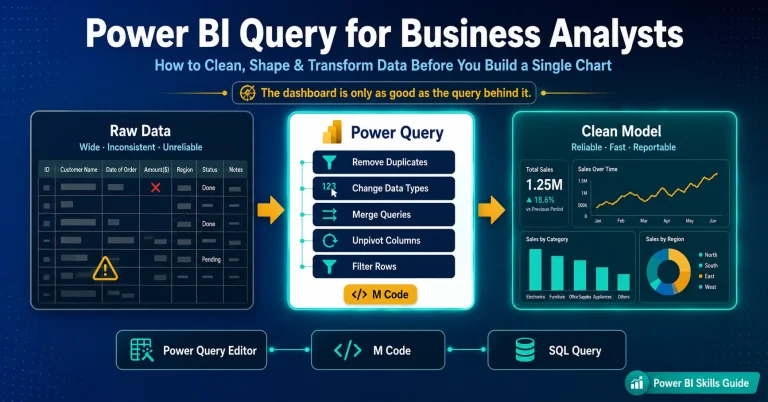
Correct errors, remove duplicates, handle missing values, and standardise formats such as inconsistent date entries. This step typically takes 60 to 80% of total project time.
Analyse the data
Apply statistical or mathematical techniques to discover patterns, relationships, or trends in the cleaned dataset using tools such as R, Python, or Excel.
Visualise the results
Present findings as charts, graphs, and dashboards. A text-only interpretation is far less powerful than a clear visual one for explaining what the data shows.
Share insights and measure effectiveness
Present conclusions to stakeholders in plain language, then validate the solution by measuring actual results against expectations, repeating the cycle if targets are not met.
Want the full lifecycle breakdown?
See our detailed guide to the seven phases of the data analytics lifecycle, with worked examples.
Key concepts in data analytics
Before working effectively with data analytics, you need to understand several core concepts that come up repeatedly across all types of analytics work.
| Concept | What it Means |
|---|---|
| Structured vs unstructured data | Structured data is organised in rows and columns, like a spreadsheet or database table. Unstructured data has no predefined format, like emails, social posts, images, or audio. Most analytics work starts with structured data. |
| Quantitative vs qualitative data | Quantitative data is numerical and measurable, such as revenue or temperature. Qualitative data is descriptive and categorical, such as customer feedback or job titles. Analytics often combines both. |
| Data cleaning | The process of identifying and correcting errors, inconsistencies, and missing values before analysis begins. Clean data is essential for reliable results, summed up by the principle “garbage in, garbage out.” |
| Statistical significance | A result is statistically significant when it is unlikely to have occurred by chance. This helps analysts determine whether a pattern in data is real or random variation. |
| Correlation vs causation | Correlation means two variables change together. Causation means one variable directly causes a change in another. Confusing the two is one of the most common errors in data analysis. |
| Dashboard | A visual display consolidating key metrics into a single view, updated in real time or on a schedule, so stakeholders can monitor performance without analysing raw data themselves. |
| KPI (Key Performance Indicator) | A measurable value showing how effectively a team or organisation is achieving a specific objective. Identifying the right KPIs is the first step before any analysis begins. |
Tools used in data analytics
These tools and technologies are the foundation of data analytics work, enabling professionals to gather, examine, and visualise data accurately and efficiently.
| Tool | Category | Best For | Skill Level |
|---|---|---|---|
| Microsoft Excel | Spreadsheet | Data cleaning, basic analysis, pivot tables, charts | Beginner |
| SQL | Database querying | Extracting and filtering data from relational databases | Beginner to Intermediate |
| Python | Programming | Data cleaning, statistical analysis, machine learning (pandas, NumPy, scikit-learn) | Intermediate to Advanced |
| R | Statistical computing | Advanced statistical analysis, academic research, data visualisation | Intermediate to Advanced |
| Tableau | Data visualisation | Interactive dashboards and visual reports for stakeholders | Beginner to Intermediate |
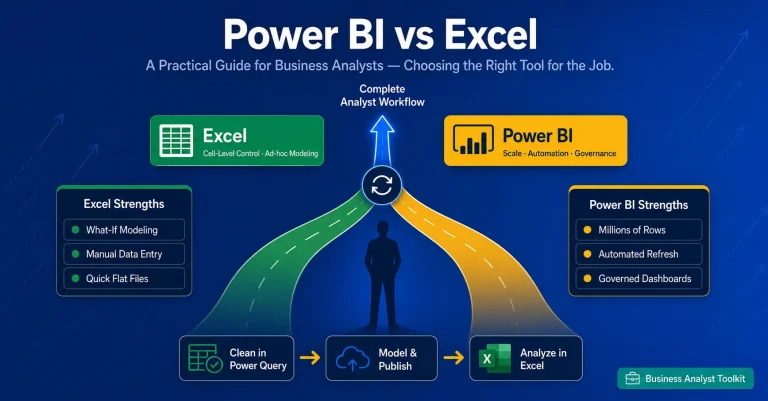
| Power BI | Business intelligence | Microsoft-ecosystem reporting, connecting Excel and Azure data sources | Beginner to Intermediate |
| Google Data Studio | Data visualisation | Free dashboards connected to Google Analytics, Sheets, and BigQuery | Beginner |
Microsoft Excel
A ubiquitous spreadsheet engine with a user-friendly interface for data manipulation and visualisation. Fundamental for basic analytics tasks and reporting.
SQL
The de-facto language for retrieving, manipulating, and managing data. Highly versatile and easy to learn, and standard SQL is supported by most databases, so you learn it once and use it everywhere.
Python and R
Python is the general-purpose language of choice for data engineers, scientists, and analysts, with extensive libraries for analysis and visualisation. R is suited for statistical computing with strong support for statistical analysis.
Tableau
Advanced data visualisation software for interactive, intuitive insights, with seamless integration across various data sources.
Power BI
Microsoft’s tool for creating dynamic, interactive reports with real-time data analysis, sharing, and integration with other Microsoft products.
SAP Business Objects
A business intelligence suite offering comprehensive reporting and performance management tools, with integration capabilities across various data sources.
Data analytics and your career: demand, salary, and the BA connection
Data analytics skills are valuable on their own, and they are increasingly expected of business analysts. Here is what the data says about demand and pay, and how the two roles relate.
21% projected growth
Operations research analysts, the closest BLS-tracked proxy for data analyst roles, are projected to grow 21% from 2024 to 2034, far faster than the 3% average for all occupations.
$91,290 median wage
The May 2024 median annual wage for operations research analysts was $91,290, compared with $49,500 across all U.S. occupations.
$112,590 for data scientists
Professionals who move into advanced data science roles see a further jump: the May 2024 median wage for data scientists was $112,590, with 34% projected growth.
Do business analysts need data analytics skills?
Increasingly, yes. A traditional BA focuses on requirements, stakeholder communication, and process documentation. A BA with data analytics skills can additionally validate requirements against real data, build dashboards for stakeholders, and support evidence-based decisions rather than relying only on what stakeholders report.
This does not mean every BA needs to become a data scientist. Most BAs benefit from data analytics fundamentals plus Excel and SQL, with Power BI or Tableau added once they are comfortable, before considering more advanced tools like Python or R.
Want a deeper dive into BA career paths?
See our complete guide to business analyst career stages and growth tracks, including data-focused roles.
Which data analytics skills should you learn, and in what order?
Skipping straight to advanced tools is the most common mistake beginners make. Build skills in this order for the fastest path to being useful with real data.
Spreadsheet fundamentals
Pivot tables, VLOOKUP/XLOOKUP, basic charts, and data cleaning in Excel. Most entry-level data roles require Excel proficiency, and it is the fastest way to start working with real data immediately.
Basic SQL
SELECT, WHERE, GROUP BY, and JOIN statements to query databases directly. SQL is required for almost all data analyst roles and lets you extract data without waiting on a developer.
Data visualisation
Build charts and dashboards in Tableau Public or Power BI Desktop, both free to start. Focus on telling a clear story with data rather than technical complexity.
A real, end-to-end project
Use a public dataset from Kaggle or Google Dataset Search to practise the full process: define the question, collect, clean, analyse, visualise, and share, exactly as covered earlier in this guide.
Why data analytics matters: real-world examples
Data analytics has applications across industries and functions. It improves performance, optimises processes, and predicts forward-looking outcomes.
Credit scores
Banks and financial institutions use a statistical analysis of historical customer data to decide whether to extend a loan. In the U.S. the FICO score typically ranges from 300 to 850, calculated from payment history, credit exposure, and credit type and duration.
Reducing hospital readmissions
At UnityPoint Health, predictive analytics scored every patient for readmission risk, allowing early treatment of symptoms. In under two years the hospital reduced readmissions by 40%.
Fraud detection
Transaction fraud is a persistent challenge for banks and financial institutions. Fraud detection combines statistical analysis with AI to identify and prevent fraudulent activity, though constantly changing fraud patterns remain a challenge.
Optimising inventory
Organisations selling through multiple distribution channels use prescriptive analytics for inventory optimisation, since manually determining the optimal strategy across channels becomes too complex.
How to get started with data analytics
If you are new to data analytics, build skills progressively rather than trying to learn everything at once. Here is a practical starting point.
| Step | What to Learn | Resource or Tool |
|---|---|---|
| 1 | Learn Excel for data work | Pivot tables, VLOOKUP, basic charts. Most entry-level data roles require Excel proficiency. |
| 2 | Learn basic SQL | Used to query databases and required for almost all data analyst roles. Start with SELECT, WHERE, GROUP BY, and JOIN. |
| 3 | Learn data visualisation | Practise in Tableau Public or Power BI Desktop, both free. Focus on telling a clear story rather than technical complexity. |
| 4 | Work on a real dataset | Use a public dataset from Kaggle or Google Dataset Search to practise the full process end to end. |
| 5 | Consider a certification | Once you have basic skills, a certification validates them for employers. The Google Data Analytics Professional Certificate and Microsoft PL-300 are good starting points. |
Build practical data analytics skills with Techcanvass
Two focused courses for business analysts: a Power BI course covering data modelling, dashboards, and stakeholder reporting, and IIBA-CBDA certification preparation to formally validate your data analytics competency.
Interested in a business analyst career too?
See our beginner-friendly roadmap to becoming a Business Analyst, including the role, skills, and certification path.
Frequently asked questions
What are the fundamentals of data analytics?
The fundamentals of data analytics include understanding what data analytics is, the four main types (descriptive, diagnostic, predictive, and prescriptive), the data analytics process from collection through to insights, key concepts like data cleaning and statistical significance, and the core tools used in practice such as SQL, Excel, Python, Tableau, and Power BI.
What are the four types of data analytics?
The four types are descriptive analytics (what happened, using historical data to summarise past performance), diagnostic analytics (why it happened, investigating root causes), predictive analytics (what will happen, using statistical models to forecast outcomes), and prescriptive analytics (what should be done, recommending actions based on predictions).
What is the difference between data analytics and data analysis?
Data analysis examines a specific dataset to answer a specific question and is typically project-based. Data analytics is the broader discipline that includes the ongoing tools, systems, and processes used to analyse data continuously across an organisation. Every analytics system involves data analysis, but not every data analysis task is part of a larger analytics system.
What tools are used in data analytics?
The most commonly used tools are Microsoft Excel, SQL, Python (pandas, NumPy), Tableau and Power BI, R, and Google Data Studio. Most entry-level data analyst roles require Excel and SQL as a minimum.
Do business analysts need data analytics skills?
Increasingly, yes. Data analytics skills let a BA validate requirements against real data, build dashboards for stakeholders, and support evidence-based decisions. Most BAs benefit from data analytics fundamentals plus Excel and SQL, adding Power BI or Tableau next.
What are the basics of data analytics for beginners?
For beginners: understand that data analytics turns raw data into insights, learn the difference between the four types, know the process steps (define, collect, clean, analyse, visualise, share), and become familiar with Excel and SQL. Starting with Excel and a real dataset is the most practical way to build foundational skills.
How long does it take to learn the fundamentals of data analytics?
Most people can learn the core fundamentals in 4 to 8 weeks of focused study, including the four types of analytics, basic Excel and SQL, and a complete data analysis project from start to finish. Becoming job-ready typically requires 3 to 6 months of consistent learning and practice with real datasets and tools like Power BI or Tableau.
What is the role of data analytics in business?
In business, data analytics supports decision making by turning operational data into actionable insights. Common applications include sales forecasting, customer segmentation, financial performance monitoring, supply chain optimisation, and marketing campaign analysis.