Data Analysis Skills for Business Analysts in 2026
The role of business analysts is rapidly changing with the data explosion! Are you equipped with the right skills?

The role of business analysts is rapidly changing with the data explosion! Are you equipped with the right skills?
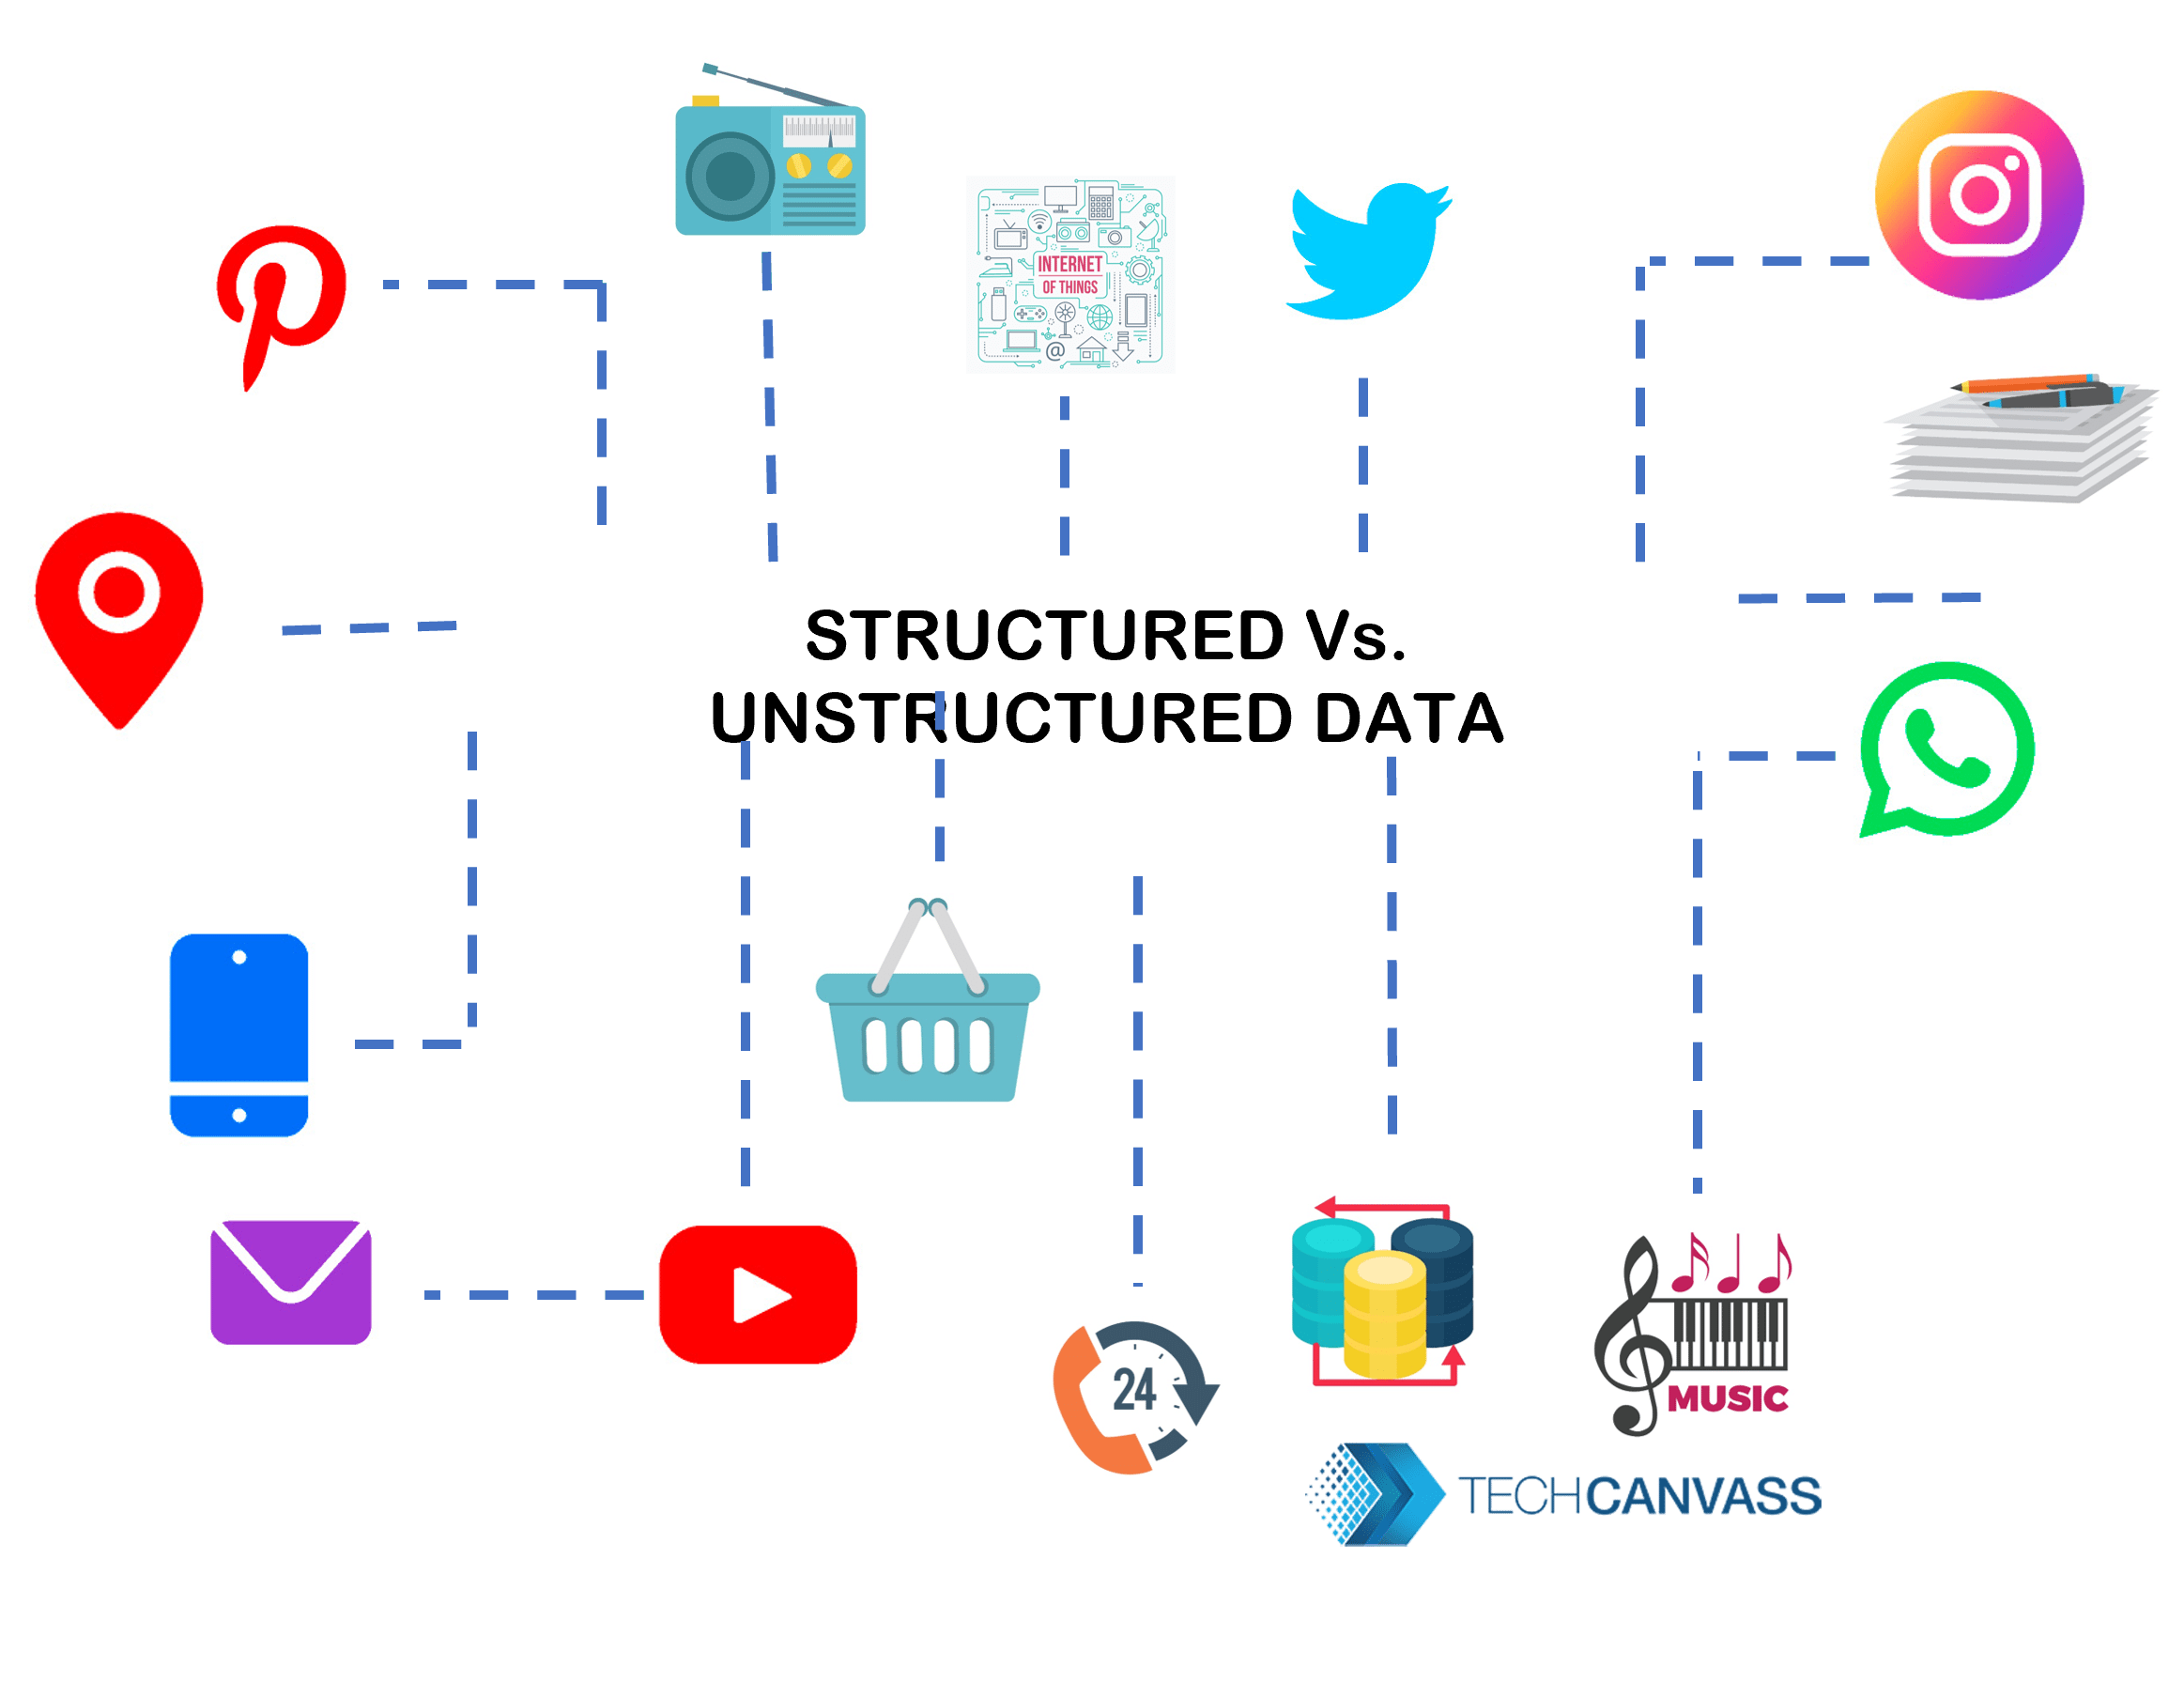
Get a closer look at the definitions, examples, use cases, and differences of Structured and Unstructured Data.
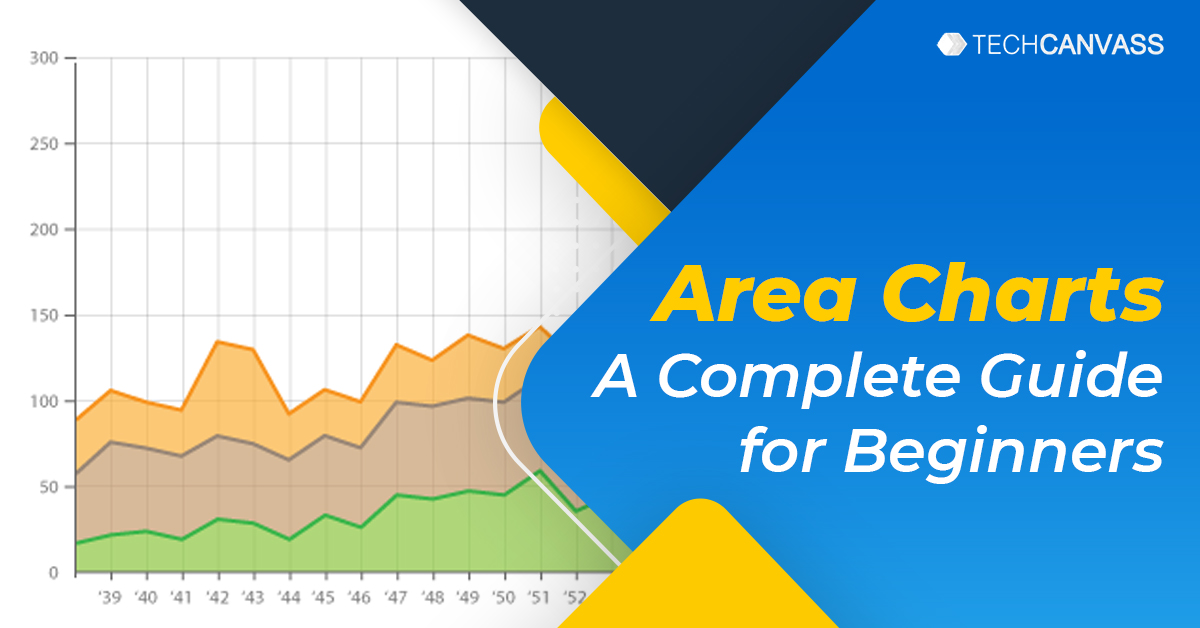
Area charts help compare trends or proportions of each category or analyze the amount of change over time. They are usually used to depict time relationships.

Top Data Analytics terms are explained in this article. Learn these to develop competency in Business Analytics. This will also help you in preparing for the IIBA CBDA Certification.

How are the Data Analytics projects executed? In this article, I am going to discuss and explain Data Analytics Projects Life Cycle.
Maps help us to analyze geographical data by plotting 3D data on a 2D plane. They are usually used when we want to answer a spatial question using data.

This certification is designed for product owners who wish to expand and improve their business analysis knowledge and skills. The International Institute of Business Analysis (IIBA) launched the Certificate in Product Ownership Analysis (CPOA) on June 1, 2021. In order to maximize the value, the product owner certification assesses business analysis and product ownership knowledge…
Excel has been around since the early 1990s way before sophisticated Business Intelligence tools like Power BI and Tableau. So, people trust Excel, are familiar with it, and can start with their analyses without spending time learning a new tool.

Data storytelling can be a turning point for the analytical success of an organization. Compelling storytelling can mean success or failure when it comes to using data for informed decision-making.
Learn more about how bullet graphs help in revealing business insights with examples.