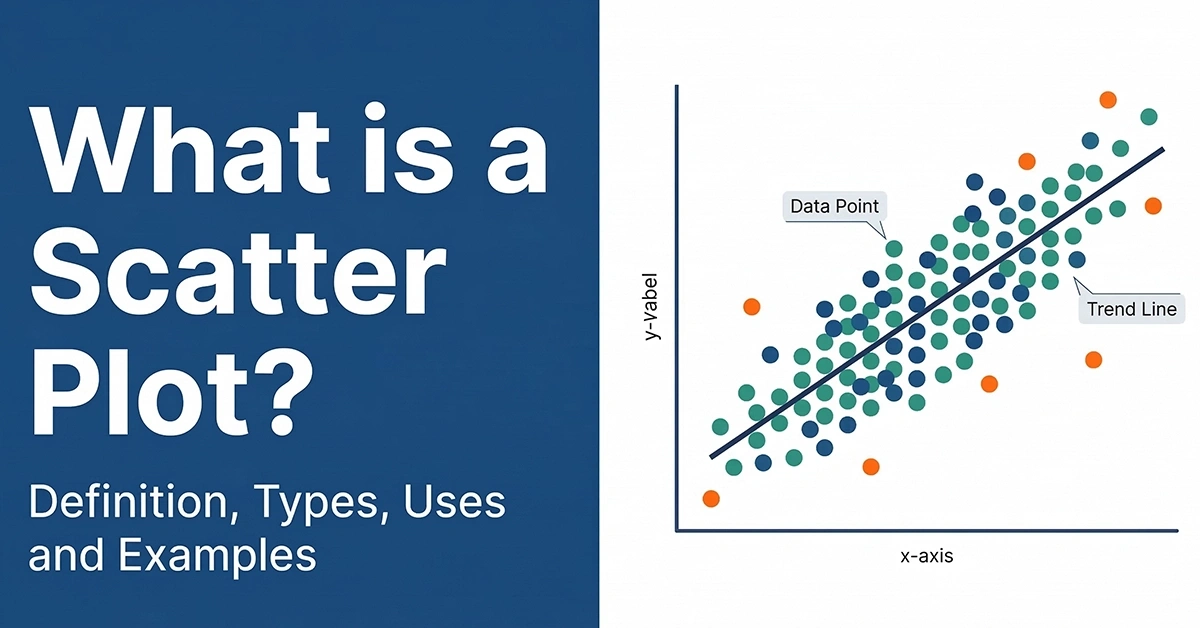
What is Descriptive Analytics?
Overview
Descriptive analytics is one of the types of Business analytics also known as exploratory Analytics. Predictive and prescriptive are the other two types of analytics. In this article, I am going to explain descriptive analytics in-depth with a real-life use case.
Business Analytics is defined as the scientific process of transforming data into insights for making better decisions and predict the outcome for the business.
Any form of analytics starts with the collection of data and developing a model to summarize and create visual patterns for better understanding. However, the real magic of Business Analytics is its capability to predict and prescribe future course of actions by analyzing current and historical data patterns.
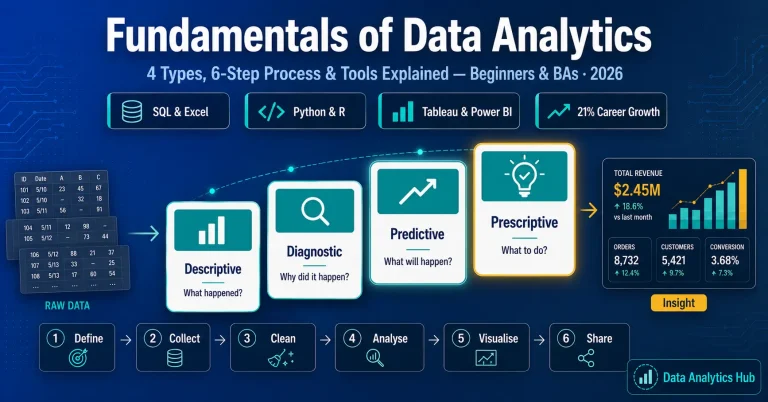
Types of Business Analytics
Business analytics can be categorized into four types, based on the depth of data analysis and the usage of that analysis.
- Descriptive Analytics tells about “What is happening?” based on the available data. It provides real-time dashboards.
- Diagnostics Analytics is used to discover or to determine “why something happened?”.
- Predictive Analytics tells about “What is likely to happen?” based on the available data.
- Prescriptive Analytics suggests decision options to handle “What is likely to happen?”
Business Intelligence (BI) was the earlier avatar of business analytics (data science) with limited capabilities to predict and to learn (machine learning).
BI used reporting tools like Hyperion, Business Objects to explore the historical data, analyze it and make sense of the same using slicing & dicing.
However, businesses today, are not looking at merely what’s been happening with my business or business initiatives but are also looking to know why, and other forward looking questions such as what if these trends continue, what will happen next, and what is the best/worst that can happen?
Descriptive Analytics
In this post, I am going to delve into descriptive analytics with examples. In my next posts (as time permits), I will talk about the other three types.
Descriptive analytics is the most basic form of analytics and lays the foundation for more advanced form of analytics. This type of analytics deals with “What has happened in the organization” and “what is happening now?”.
Every organization generates raw data in day-to-day transactions. For example, a car manufacturing company will generate data relating to inquiries made, actual sales, collections etc.
To make it even more staggering is the case of Facebook.
Facebook users generate content through posts, comments and picture uploads. This data is unstructured and is generated at a considerable rate.
Facebook statistics suggest that it processes 2.4 million posts per minute amounting to approx. 500 terabytes of data daily. These mind-boggling figures has given rise to the term “Big Data” and “Big Data Analytics”. Some other post for “Big Data”!!
Making sense of the data in its raw format will be extremely difficult. This data has to be summarized, categorized and presented in a user-friendly manner to enable managers to understand and make sense of it.
Business Intelligence and data mining tools/techniques have been the de-facto mechanisms of doing so for larger organizations. But almost every organization does some form of summarization and MIS reporting using data base reporting tools or simply excel sheets.
Descriptive analytics is characterized by three key methods to summarize and describe the raw data:
Dashboards and MIS reporting: This method typically provide summarized data providing information on “What has happened”, “What’s been happening?” and “How does it compare with the plan?”
Ad-hoc reporting: This method supplements the previous method in helping the management in extracting information as required.
Drill-Down Reporting: This is the most complex part of descriptive analytics and provides the ability to dig deeper into any report to understand the data better. Typically summary data is drilled down to understand the transactional data. For example, Q4 All India sales figure for a product is a summary figure, which can be drilled down to look at the sales figures of each city or each region.
The case study description
Let’s take an example to understand it better. I will take the example of Google Analytics as I have been using it for my company to understand the flow of users, their demographics etc.
Let me first explain the use case.
Every company wants to have its online presence and so do we. Recently we have started online marketing using Google Paid Ads and Facebook. So, we would like to know the effectiveness of our campaigns on each channel as well as the effectiveness of our SEO campaign.
Deciphering the case study
Google provides a script based tracking mechanism, so you need to put that piece of code in every page you track.
So, every time a visitor comes to our website, Google script captures the page name, the referrer, demographics etc.
If the data is presented to me in the raw format, I would get overwhelmed with the large number of columns and rows. So Google analytics engine nicely summarizes this data for me.
In the image below, it shows me the number of visitor sessions on pages, I want to track.
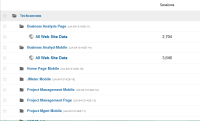
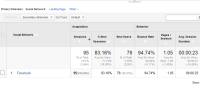
When I drill down, it shows me the sources of traffic. Google Analytics categorizes the data into paid, non-paid, social etc categories, enabling me to understand the effect of each marketing effort/campaign.
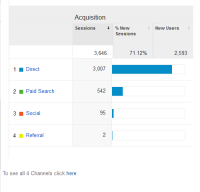
If I now want to calculate the ROI of my campaigns, I further drill it down as shown in image below.
So, descriptive analytics enables an organization to make better sense of data, by providing summarization of data and the ability to drill down.

About Techcanvass
Techcanvass offers IT certification courses for professionals. We are an IIBA endorsed education provider (EEP), iSQI Germany Authorized Training Partner.
We offer Business Analyst, Data Analytics and Domain Certification Courses in Banking, Payments, Trade Finance, Insurance and US Healthcare.
You can read many articles on Business Analysis and Data Analytics in this Business Analysis blog.