What is Heat and Tree Maps?
Table of Contents
Overview (Heat Maps)
We are going to look at two important visualizations which are used in many different fields for analysis.
In these visualizations, the color shade of areas varies as per the values in the data. The area with higher values heat up or is in a darker color shade. They are great for visualizing statistical data as well. They are usually useful when you have a large amount of data. Color differences can easily spot similar and different values and, in general, give an idea of the data variation.
They are used during A/B testing to see which parts of a web page are accessed by users in a website, the number of reviews generated every hour, or to analyze a cricket match to understand the area in which the batsman is scoring the bulk of his runs, or where the bowler is pitching his ball.
They help in comparisons between one or more dimensions and one or two measures. Along with color, size is also used to highlight patterns within the data. Let us look at a few examples to get an idea.
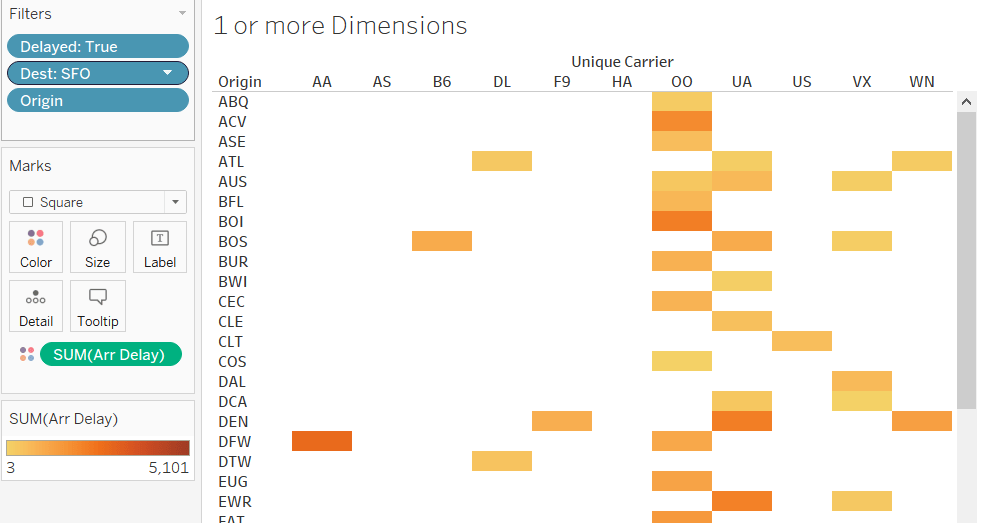
Let us look at the flight arrival delay data and compare – Unique Carrier and Origin (two dimensions) with the sum of Arrival Delay (one measure). The data set contains weather, security, and late aircraft delay data from different origins to different destinations in the US. We will look at arrival delays to the destination of San Francisco (SFO) from different origins and carriers.
We can see from Figure 1 that the arrival delay in SFO is maximum from Chicago O’Hare (ORD) origin. Also, Delta(UA) and Sky West (OO) carriers have maximum arrival delays to SFO from different origins than other carriers.
Useful Links

Download CBAP/CCBA Preparation Guide
A complete study companion — exam strategy, practice questions, and a step-by-step study plan to help you pass CBAP or CCBA with confidence.
You can scroll down to check other origins.
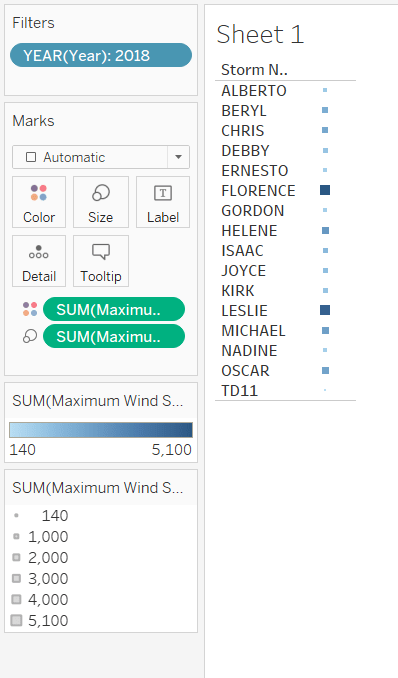
Let us analyze different hurricane storms across years. This data shows the day and time-wise path of different hurricanes across years. We will compare Storm Name (one dimension) and the sum of Maximum Wind Speed and the sum of the Minimum Central Pressure (two measures) for storms in 2018. Here color represents the pressure while the size represents the speed.
After observing Figure 2, we can conclude that Florence has the darkest color hence the highest Maximum Wind Speed, and Leslie has the biggest size and, therefore, the highest Minimum Central Pressure.
Tree Maps
Tree maps represent data from large data sets into nested rectangles with different sizes and colors. The nested rectangles are like the branches of the tree; hence they are called tree maps. The main boxes, as well as the nested boxes, are sorted automatically as per their size.
They are primarily used for comparative analysis and help to identify anomalies and similarities in multiple variables in the data set. The simple structure of visualization can appeal to the attractive side of the users. They can be used to analyze sales of products as per their subcategories in a supermarket, crime rate comparison in different parts of the city or spread of an infectious disease in different areas, and much more.
One or more dimensions and one or two measures are needed to plot a tree map. The dimensions define the tree map structure, and the measures define the size or color of the individual rectangle.
They may not be the best choice when there is a big difference in the measure values. A precise comparison may sometimes not be possible with tree maps.
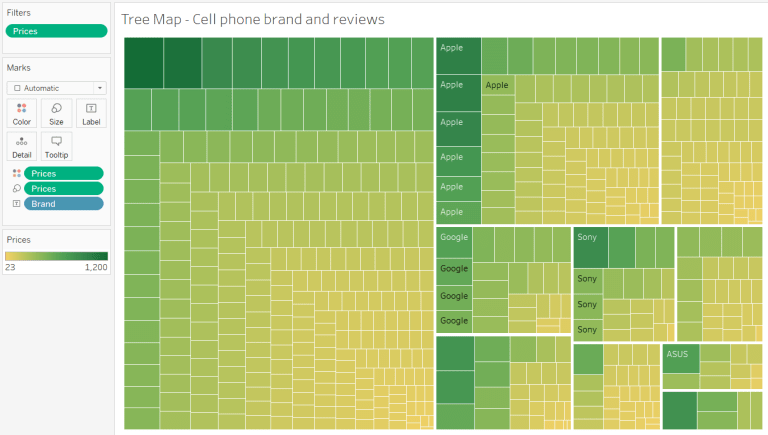
Let us explore the data set containing data about cell phones – their prices, reviews, and ratings of different mobile brand models. We will compare the Price (measure) of different Brands (dimension).
We can look at Figure 3 and easily compare brands to conclude that Samsung has some of the highest-priced phones, followed by Apple. OnePlus and Google have phones in the higher ranges only. Motorola and Nokia have phones in relatively lower ranges.
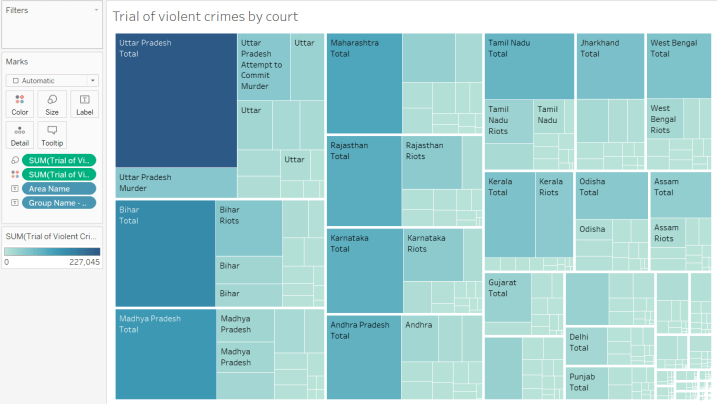
Let look at the dataset containing the state-wise trial count of violent crimes by the court. We will compare Area Name and Crime group name (two dimensions) with the sum of Trial of Violent Crimes by Court (one measure).
Figure 4 shows the sum of counts of cases for trials of different crimes in various states. We can easily see that Uttar Pradesh has the maximum number of trials, followed by Bihar and Madhya Pradesh. The highest trials are in Bihar, for Riots.
Thus, we can say that we can quickly compare data or find similarities and anomalies in the data using color and size. This helps us to differentiate swiftly and help find the maximum and minimum values as well.

Useful Links
About Techcanvass
Techcanvass is an Information Technology certifications training Organization for professionals. It offers internationally recognized certifications in the fields of Project Management and Business Analysis. It is a premier Authorized training partner of Project Management Institute (PMI), USA, and a premier Endorsed Education Provider (EEP) of International Institute of Business Analysis (IIBA), Canada.
Founded by IT professionals, Techcanvass is committed to making learning a more structured, practical and goal-oriented exercise. We also provide consulting services in the fields of Project management and Business Analysis.
We also offer IIBA Certification courses and Domain Certification Courses in Banking, Payments, Trade Finance, Insurance and US Healthcare.
Techcanvass provides CBAP Course, CCBA Course, ECBA Course and Agile Analysis Certification (AAC) Course.
Our latest offerings: PMP Certification Training and Product Ownership Analysis Training (IIBA CPOA)