How to Automate Your Weekly Reports with AI Tools
Table of Contents
Overview
Creating business reports manually has always taken a lot of our time and efforts. You have to first collect the data, sort or clean the data, try finding insights, and then write the report. I myself end up creating such reports sometimes every week or month. This process is not only slow but also leave room for us to make mistakes. I in fact sometimes feel like a daunting task with all the peer pressure. Now think about your typical week. How many hours do you spend collecting data from different sources, creating the same charts you made last week, and formatting reports that follow identical templates? I’m quite sure like most analysts, it’s probably 40-60% of your time—time that could be spent on strategic analysis, or something more fruitful. And If I may say what if AI could lend a hand? That’s exactly how does Generative AI work to simplify the entire reporting process.
In this article, we are going to understand how does Generative AI work and how you can create a weekly report using different AI tools. We will be covering everything from basic like setting up the data sources to generating reports in a step-by-step process. So, grab a cup of coffee or tea, and let’s get started!
How Does Generative AI Work in Reporting
At a high level, here is how it generally works, step-by-step:
- Data Input: You upload your raw data that you for report creation (Excel, CSV, or from a dashboard).
- Data Understanding: The AI tool whichever you use from below list reads and understands the data: your numbers, columns, and trends.
- Insight Generation: It finds what is essential or crucial, like an increase in sales figures or customer behavior changing over time.
- Text & Chart Creation: The AI writes clear summaries, creates visual charts, and gives suggestions.
- Final Report: You get a complete report ready to send or present.
Companies are already using tools like GPT (from OpenAI), Google’s Gemini, and custom-trained AI models for this purpose. This is another great way to understand how does Generative AI work in professional settings.
To truly master automation, consider enrolling in our comprehensive AI Data Analyst Course & Certification, designed for professionals ready to upskill with Generative AI tools.
If you’re aiming for a broader foundation in analytics and intelligence, our Data Analytics and AI Course offers hands-on training with real-world projects.
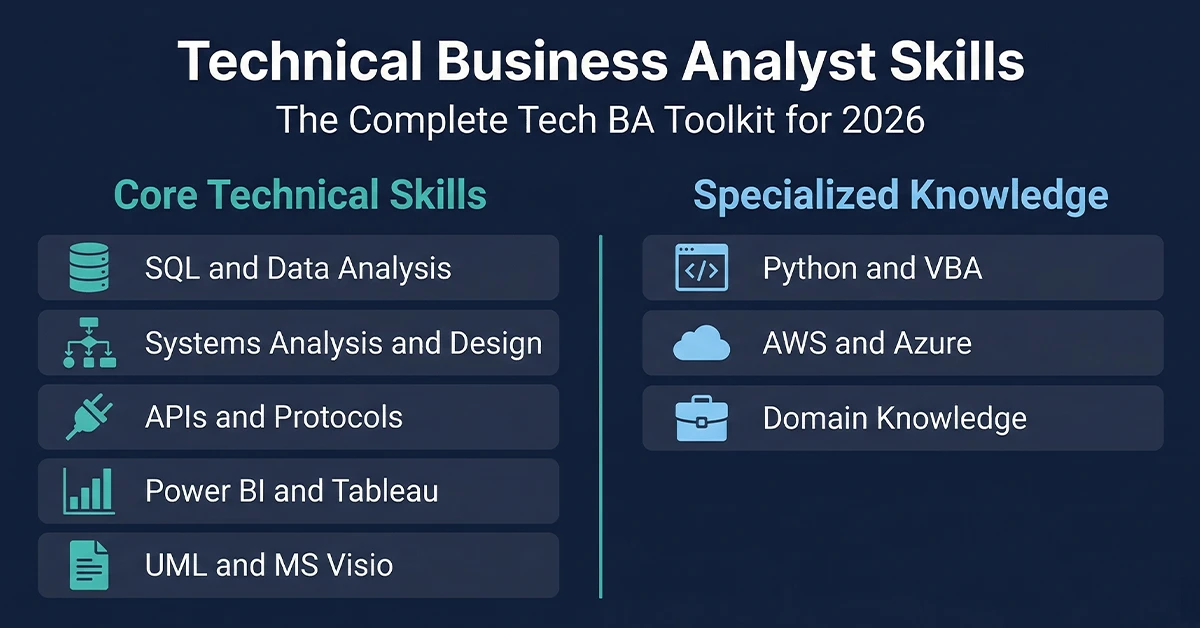
To understand the evolving role of analysts in the age of automation, explore who is an AI Data Analyst, their key skills, and how they’re shaping business decisions.
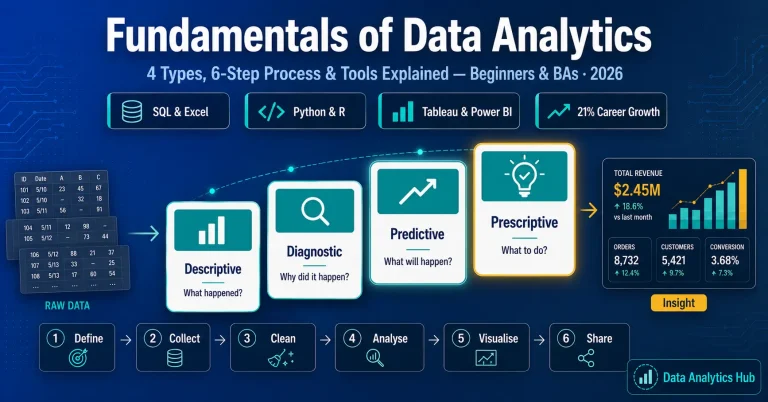
If you’re just starting your analytics journey, it’s essential to first grasp the fundamentals of data analytics—from data types to basic techniques and tools.
How to Get Started (Tools for Automated Report Generation)
You will see, you don’t need to be a data scientist to use Generative AI in your day to day activities. There are so many tools out there that offer easy-to-use platforms with drag-and-drop features. You can also try building custom solutions using tools like:
- ChatGPT (for text generation)
- Tableau + GPT plugins
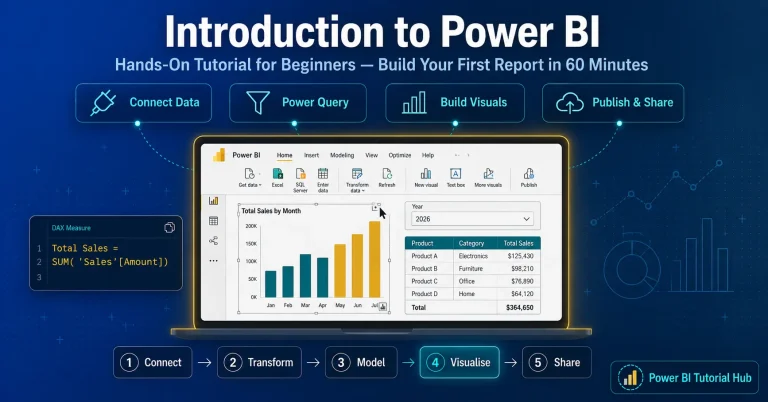
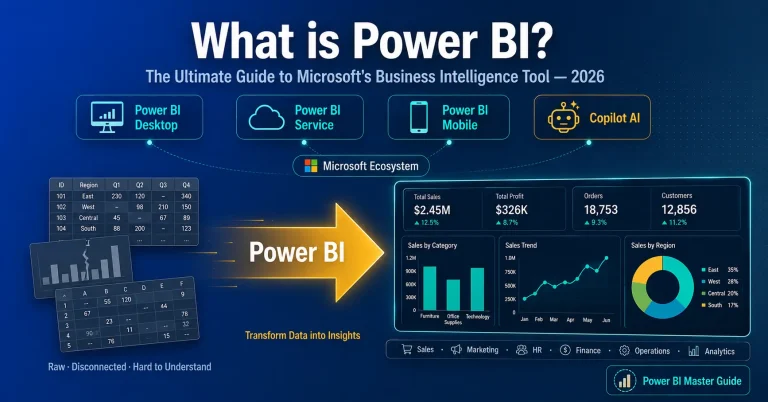
- Microsoft Power BI with Copilot
| Tools list | What are the Key Features | Ideal for which Use Cases |
| Microsoft Power BI + Copilot | You can ask queries in Natural-language, You can schedule dashboards. | Weekly sales scorecards, dashboards for executives |
| Tableau with Einstein Discovery | AI-driven insights, anomaly detection, can perform predictive modeling | Customer churn reports, product usage trends |
| ChatGPT (with Plugins) | Create narrative summaries, one can also create dynamic charts via APIs | Customer-support reports, project-status overviews |
| Google Data Studio + Vertex AI | Allows you to perform automated data pulls, has access to custom ML models,. | Best suited for Marketing campaign snapshots, web-analytics |
Each of the tools in the table above can connect to your data sources whether it’s a spreadsheet, database, CRM, or cloud warehouses. These tools then use AI to crunch, visualize, and even narrate the results. Make sure you pick the one that best fits your ask and reporting goals. This shows again how does Generative AI work across a range of tools.
Implementation Guide: Your Path to Automated Reporting
Now that you know how does Generative AI work, let’s walk through a practical way to automate reporting:
Step 1: Audit Your Current Reporting Process
Before you automate any report, capture the existing workflow in your report end to end. Like,
- Which reports do you create regularly?
- What data sources do you use?
- How much time of your day does each report take?
Step 2: Pick the Right AI Tool
Match your specific reporting needs to available tools listed above. While selecting, consider factors like:
- Integration capabilities with your existing data sources
- Learning curve and user-friendliness
- Customization options
- Security and compliance features
Step 3: Start Small with an easier report
Choose one regular report to automate first (Small POC). This approach allows you to:
- Demonstrate value quickly
- Learn and adjust before you create a large, big size report
- Address concerns and resistance in a controlled environment
Step 4: Create Your Automated Workflow
Sketch or record how data will flow from source systems to your AI tool and ultimately to stakeholders:
- Data extraction and connection points
- Cleaning and transformation rules
- Analysis parameters
- Visualization and presentation formats
- Distribution methods and schedule
Step 5: Implement, Test, and Refine as per your need
Execute your automated reported generation, but also maintain parallel manual process initially to validate outputs. You may also incorporate feedback from those who read these reports and then you can continue refining the automated approach until it meets or exceeds the quality of manual reports.
Step 6: Grow Strategically
Once your POC is successful, Identify a report that can create the highest-value from this automation based on time spent and strategic importance.
Following these steps will help you fully appreciate how does Generative AI work at scale within your organization.
To truly master automation, consider enrolling in our comprehensive AI Data Analyst Course & Certification, designed for professionals ready to upskill with Generative AI tools.
If you’re aiming for a broader foundation in analytics and intelligence, our Data Analytics and AI Course offers hands-on training with real-world projects.
To understand the evolving role of analysts in the age of automation, explore who is an AI Data Analyst, their key skills, and how they’re shaping business decisions.
If you’re just starting your analytics journey, it’s essential to first grasp the fundamentals of data analytics—from data types to basic techniques and tools.
Example: Monthly Marketing Campaign Performance Report Automation
Imagine you are an analyst for a digital marketing for a growing e-commerce brand. On the first of every month, you export your campaigns data into an Excel sheet. This data includes:
- Campaign names (Spring Sale, Summer Launch, etc.)
- Ad spend per campaign
- Impressions and clicks
- Conversions (form fills, purchases)
- Channels (Google Ads, Facebook, Instagram, LinkedIn)
Now usually, maybe either you or someone from your team would manually perform below tasks:
- Export data from each ad platform (CSV from Google Ads, Facebook Ads Manager, etc.).
- Consolidate in case of multiple files into one master Excel sheet and standardize campaign names.
- Build pivot tables to calculate total spend, clicks, and conversions by channel.
- Create visuals:
- Bar chart of spend vs. conversions per campaign
- Line graph of month-over-month trends
- Pie chart of channel mix by conversion share
- Then write a text summary, for example:
“In May, the Spring Sale campaign spent ₹1.2 lakhs for 500 k impressions and 10 k clicks, yielding 350 conversions at a ₹343 CPA. Facebook drove 60% of conversions, while Google Ads delivered a lower CPA of ₹310.”
6. Copy charts and summary into your reporting deck or email template.
This process typically chews up 3–4 hours at the start of the month—That’s exactly how does Generative AI work to replace repetitive reporting tasks.
Now, Let’s Bring in Generative AI
Here’s where Generative AI changes the game. Think of it like having a really smart assistant that:
- Can read your sales data.
- Can understand what’s happening inside it.
- Can write a summary on its own.
- Can build charts for you, too.
All of this within a few seconds.
How It will Actually Work (In Simple Terms)
- You upload your Excel file or connect it to a dashboard like Tableau or Power BI or any other tool I mentioned above.
- The Generative AI tool scans your data, just like your brain would. The AI parses dates, products, channels, and regions—no manual cleanup needed.
- It picks up on things like “Product A has the highest sales” (top SKUs) or “Revenue is up by 15%.” (regional spikes)
- It then writes a full report for you, using natural language, almost like a human would.
- Some tools can even add colorful bar charts or pie graphs to make it look great.
This is how does Generative AI work in the real world of data reporting.
Real-World Outcome
Instead of spending 2–3 hours making a sales report, you now get:
- A ready-to-use report in minutes
- Automatically updated each month.
- Zero manual effort
- Consistent formatting and fewer mistakes
This is not just automation. It’s how does Generative AI work to drive actual productivity gains and this is a great example how you can show your efficiency by using AI tools. You can also measure the time you are freeing as efforts saving to take on additional tasks.
Examples of some Reports that you can automate:
- Marketing Teams: AI-generated performance reports from ad campaigns.
- Sales Teams: Monthly Sales summaries with insights and recommendations.
- Finance Departments: Reports involving Budget tracking, summaries of expenses, and revenue forecasts.
- Customer Support: No of tickets received vs resolved, Average number of tickets resolved, etc.
Each of these use cases showcases different aspects of how does Generative AI work in business environments.
Best Practices for Report creation
- Prioritize Data Quality: Remember, Garbage in is garbage out. AI is only as good as the data you give it. Automate validation rules and build in alerts when source feeds fail.
- Keep Humans in the Loop: Even the smartest AI can misinterpret a sudden spike. Schedule a quick sanity-check cadence.
- Document Your Workflow: Map your end-to-end pipeline (data source → AI engine → delivery). That makes troubleshooting a breeze.
- Manage Access & Security: Make sure sensitive data is protected. Use role-based permissions and encrypt sensitive reports in transit.
If your team is hesitant about AI adoption, you can start small and show them how does Generative AI work in a live demo with real reports. That alone can build confidence.
Conclusion
Not everyone from your team will be comfortable working with AI tools. By embracing AI for Report automation, you position yourself at the intersection of technology and business strategy, exactly where the most valuable insights and careers are built. Understanding how does Generative AI work empowers you to optimize your workflow, gain insights faster, and add more value to your organization.
To truly master automation, consider enrolling in our comprehensive AI Data Analyst Course & Certification, designed for professionals ready to upskill with Generative AI tools. If you’re aiming for a broader foundation in analytics and intelligence, our Data Analytics and AI Course offers hands-on training with real-world projects.
To understand the evolving role of analysts in the age of automation, explore who is an AI Data Analyst, their key skills, and how they’re shaping business decisions. If you’re just starting your analytics journey, it’s essential to first grasp the fundamentals of data analytics—from data types to basic techniques and tools.