Top 12 Data Analytics Tools in 2026
The field of data analytics is essential for obtaining practical insights in the age of data-driven decision-making. With the correct data analytics tools, data may be fully realized and used as a strategic asset by companies in a variety of sectors.
Now, there are a range of Data Analytics Tools available in the market, so you may find it challenging to decide which tool best suits your specific needs. In this detailed guide, we will take you on a quick journey through the best Data Analytics Tools for data analytics.
Let’s get started!
What are the Most Popular Data Analytics Tools?
Now, there are a range of Data Analytics Tools available in the market, so you may find it challenging to decide which tool best suits your specific needs. In this detailed guide, we will take you on a quick journey through the best Data Analytics Tools for data analytics.
1. Microsoft Visio:
- Type of tool: Software for diagramming and visualizing
- Availability: Commercial
- Mostly used for: Putting intricate data structures and procedures on display.
When it comes to using diagrams to visualize complex data relationships, Microsoft Visio is a top choice among Data Analytics Tools. Its features cover flowcharts, organizational charts, and network diagrams, making complicated data structures easier to comprehend and communicate. Analysts can use Visio to present data in visually appealing ways, enhancing stakeholders’ understanding across various sectors.
Among Data Analytics Tools, Microsoft Visio offers a variety of diagram templates and shapes that simplify the design process. However, some users may be deterred by its expense and complexity, and it may take time to fully master.
Want to master Visio for clear communication? The Visio Training Course with UML Diagrams unlocks the power of Microsoft Visio. Master UML diagrams through hands-on creation of use cases, activity diagrams, and class diagrams using a real-world case study. Simplify data for stakeholders, boost efficiency with Visio templates, and transform communication.
2. Structured Query Language, or SQL:
- Type of tool: Relational database management query language.
- Availability: Both commercial and open-source (with multiple implementations).
- Mostly used for: Managing, modifying, and retrieving data from databases.
The foundation for working with relational databases is SQL. By providing features for database management, retrieval, and modification, it enables analysts to work with data. This language makes it possible to create queries that filter, sort, and aggregate data in order to extract insights.
Among Data Analytics Tools, SQL’s basic syntax is straightforward, but mastering complex queries requires a deep understanding of database architecture and query optimization. Various implementations, such as PostgreSQL, Oracle, and MySQL, cater to different user needs and offer unique features and functionalities
Are you ready to unlock the power of databases through SQL? If yes, then SQL Training is the perfect choice for you. This comprehensive course covers SQL basics, simple Joins, outer and inner join, SQL functions, and much more.
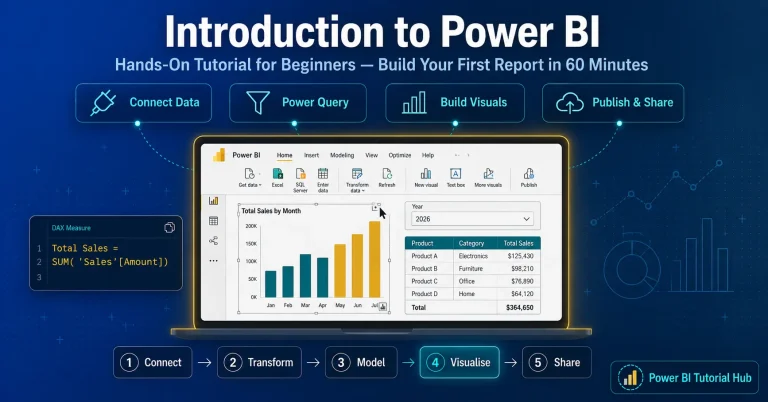
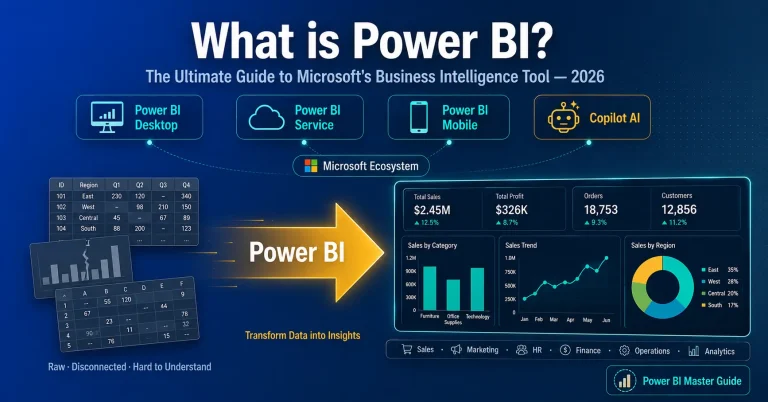
3. Power BI for Microsoft:
- Type of tool: Software for business intelligence
- Availability: Commercial
- Mostly used for: Building dynamic dashboards and reports to support data-driven decision-making.
One of the best business intelligence tools is Microsoft Power BI, which turns unprocessed data into visually appealing dashboards and reports. Because of its intuitive interface, users can create interactive visualizations and make data-driven decisions in a variety of business contexts.
Among Data Analytics Tools, this tool’s extensive data connectivity options enable seamless integration with a wide range of data sources, which is one of its key features. However, to fully leverage its capabilities, complex analytics and data transformations may require familiarity with DAX (Data Analysis Expressions) and the Power Query M (Formula Language).
Useful Link – Power BI: Introduction, Key Features, and Importance
4. Python
- Type of tool: Programming language
- Availability: Open-source
- Mostly used for: Machine learning, analysis, and data manipulation applications.
Python is one of the most popular programming languages among data analysts due to its versatility. Data manipulation, exploration, statistical analysis, and machine learning activities are made easier by its extensive libraries, which include Pandas, NumPy, and Scikit-learn.
Python’s readability and simplicity, which make it useful for both novices and seasoned analysts, are among its best features. Its broad acceptance in the data analytics industry is partly due to its strong library environment and large community support.
5. R:
- Type of tool: Programming language for statistics.
- Availability: Open-source
- Mostly used for: Data visualisation and statistical analysis.
R is unique in that it is a specialised language designed for data visualisation and statistical analysis. For in-depth data analysis, statistical modelling, and graphical representations, analysts utilise its vast range of statistical functions and packages.
Among Data Analytics Tools, researchers and analysts in academia and industry prefer this language for extensive statistical analysis due to its strong capabilities in handling complex operations. While it may have a steep learning curve for beginners, its appeal lies in its flexibility and extensive community support.
6. Tableau:
- Type of tool: Data visualization visualization software.
- Availability: Commercial.
- Mostly used for: Developing dynamic and captivating data visualisationsvisualizations.
Tableau is a master in data visualisation, providing an intuitive user interface for creating dynamic and engaging visuals. With its drag-and-drop feature, analysts may create intelligent visualisations without needing to know a lot of code.
Its popularity is attributed to its fast creation of interactive dashboards and its ability to link to numerous data sources. However, certain users looking for extensive functionality may find it difficult to work around its licensinglicencing fees and limits in complex data conversions.
Checkout Our Data Analytics Course
Check out our Data Analytics Fundamentals course if you want to learn more about the principles of data analytics and how to use these tools efficiently. At Techcanvass, when you enroll for the course, you will be getting access to online training sessions, recorded videos, chapter-wise quizzes, data analytics basic guide, case studies, one year access to the course, and last but not the least, the proficiency certificate.

7. Google Cloud AutoML:
- Type of tool: Machine learning model building platform.
- Availability: Commercial.
- Mostly used for: Simplifying machine learning model creation.
With its intuitive interface, Google Cloud AutoML makes the process of creating machine learning models easier. It enables users to build bespoke models for a variety of tasks, including text analysis and image identification, even with no experience with machine learning. Its interface with Google Cloud services makes managing and deploying machine learning models easier. However, depending on usage, its commercial nature can have financial ramifications.
8. Google Data Studio
- Type of tool: Data visualisationvisualization and reporting software.
- Availability: Free and Commercial versions.
- Mostly used for: Establishing dynamic reports and dashboards.
Users can generate dynamic, aesthetically pleasing reports and dashboards from a variety of data sources using Google Data Studio. Data-driven decision-making is encouraged by its drag-and-drop interface, which makes the construction of interactive visualizations easier. Basic functions are available in the free version, while extensive capabilities and integration options are available in the commercial version. However, depending on how well-versed users are in comparable programmes, the learning curve may differ.
9. SAS:
- Type of tool: Analytics and statistical software suite.
- Availability: Commercial.
- Mostly used for: Advanced statistical analysis and predictive modeling.
SAS is well-known for its extensive analytics toolkit, which includes capabilities for predictive modeling, data management, and advanced statistical analysis. Because of its dependability and comprehensive analytics capabilities, it is widely used in sectors including healthcare and finance. However given its commercial nature, it might be more expensive than open-source alternatives, and its complexity might necessitate specialized knowledge.
10. Zoho Analytics:
- Type of tool: Business intelligence and analytics software.
- Availability: Commercial.
- Mostly used for: submitting a report dashboard creation, as well as data analysis.
Among Data Analytics Tools, SAS is renowned for its extensive analytics toolkit, offering capabilities for predictive modeling, data management, and advanced statistical analysis. Its reliability and comprehensive analytics make it popular in sectors such as healthcare and finance. However, due to its commercial nature, SAS may be more costly than open-source alternatives, and its complexity might require specialized knowledge.
11. Domo
- Type of tool: Cloud-based business intelligence platform.
- Availability: Commercial.
- Mostly used for: Real-time data insights and collaboration.
Among Data Analytics Tools, Domo is a cloud-based platform for business intelligence that offers collaboration tools and real-time data analytics. With its intuitive interface, organizations can extract valuable insights from data with minimal technical expertise. Its cloud-based approach ensures scalability and accessibility, though its cost structure may be a consideration depending on an organization’s needs and data usage.
12. Jupyter Notebook:
- Type of tool: Open-source web application for interactive computing.
- Availability: Free and open-source.
- Mostly used for: Developing and distributing documents with live code, data visualizations, and stories.
Among Data Analytics Tools, Jupyter Notebook is a flexible tool that allows data scientists and analysts to create documents with live code, visuals, and narrative text. Its interactive environment supports multiple programming languages, such as Python, R, and Julia, encouraging collaboration and reproducibility in data analysis. The open-source design enhances its functionality, supported by a thriving community and a vast library of plugins and extensions. However, optimal usage may require technical expertise for setup and configuration.
Factors to Evaluate When Selecting the Tool
Here are some factors that you must consider before you go ahead and select a data analytics tool for your ease.
- Compatibility and Integration: Evaluate how well the product integrates with current data sources and systems. Take into account how well it integrates with the various platforms and solutions your company uses to guarantee collaboration and efficient data flow.
- Flexibility and Scalability: Assess how well the tool can adapt to changing business requirements and increasing data volumes. For long-term use, it is essential to have a versatile tool that can adjust to changing requirements without causing major disruptions.
- Usability and Learning Curve: Take into account how easy it is to use the product as well as any accompanying learning curves. A user-friendly layout and simple features make it easier for the team to adopt and use the tool more effectively.
- Cost and ROI: Evaluate the entire cost of ownership, taking into account the initial outlay, maintenance expenses, license fees, and training costs. Examine the tool’s return on investment (ROI) in terms of increased productivity, new insights, and effects on business results.
- Security and Compliance: Give data security and adherence to industry rules a first priority. To protect sensitive data, make sure the product complies with strict security guidelines, data encryption standards, and compliance criteria.
Every one of these elements is crucial in establishing if a data analytics tool is appropriate, affecting how well it meets organizational goals and helps facilitate successful data-driven decision-making.
Conclusion
Choosing the right Data Analytics Tools is essential in the ever-changing field of data analytics to gain meaningful insights and drive company growth. Important considerations such as compatibility, scalability, usability, cost, and security will help guide the decision-making process, ensure alignment with organizational objectives, and optimize the utilization of data assets.