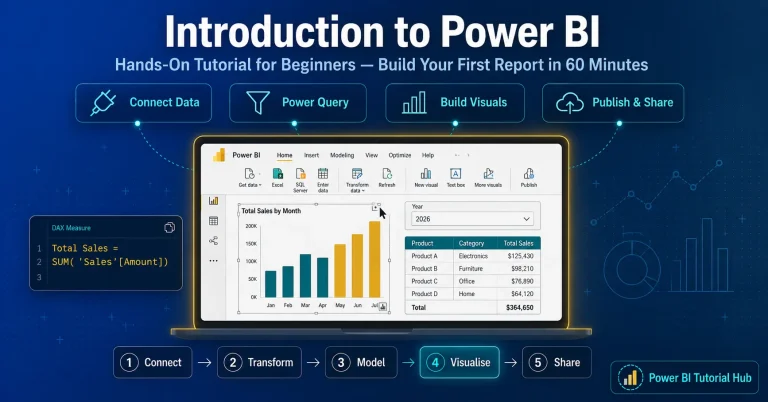
Data Analysis using Excel for Complete Beginners
What is so great about analyzing data in Excel? Well, Excel has been around since the 1990s, way before sophisticated Business Intelligence tools like Power BI and Tableau. So, people trust Excel, are familiar with it, and can start with their analyses without spending time learning a new tool. Since, Many people are more comfortable working with Excel. So, In this post we will learn the basics of Excel, one of the most popular data analysis tools, to help visualize and gain insights from your data analysis using excel.
For instance, the fundamental goal of data analysis using Excel is to understand the data and derive meaningful, actionable insights. Excel can achieve this at affordable prices, making it a popular choice for many professionals. The new enhancements by Microsoft have definitely contributed to the continued popularity of Excel, as it is widely used for its powerful analytical capabilities, allowing users to perform complex data analysis efficiently.
Data Analysis Using Excel with Techcanvass
Hence, we will be covering various features and functions that make Excel a powerful data analysis tool. To put these concepts into practice, we will use the telecom churn dataset from Kaggle as an example. Since most of the concepts are demonstrated using this dataset, it will provide a practical understanding of data analysis using Excel. Churn refers to a customer leaving the service to join another, and all businesses aim to prevent churn and retain their customers. As such, churn is an essential metric across industries. Below is a snippet of the data:

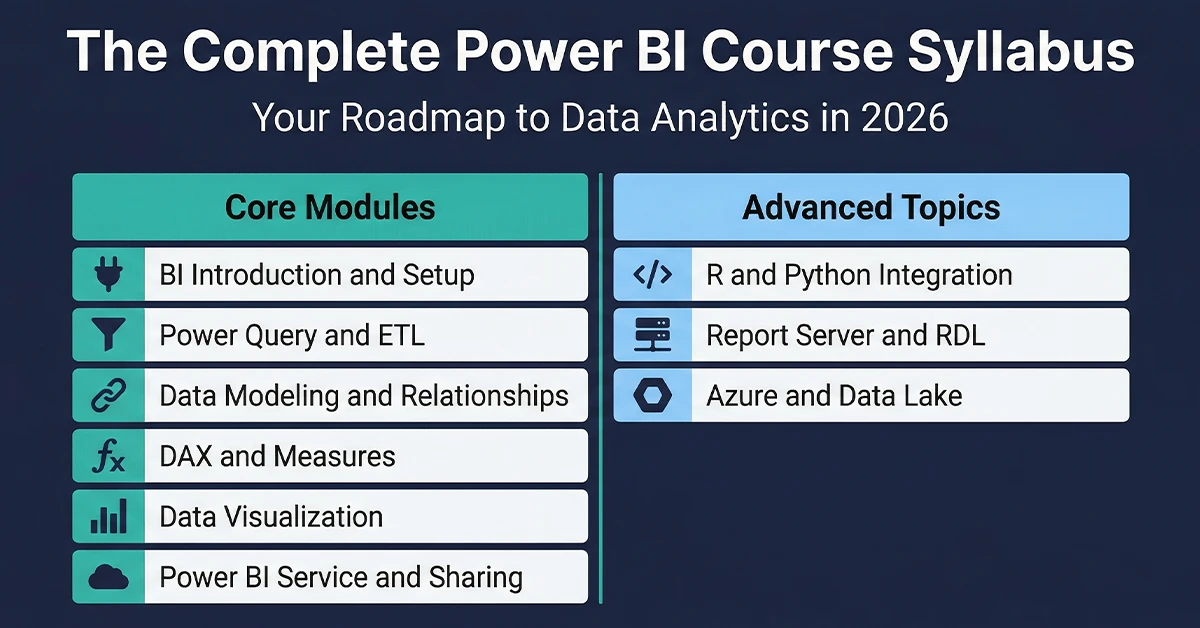
Useful Links – Power BI Training | Data Analytics Fundamentals Course
Powerful Features Excel offers to Analyze Data
Let us look at the key analytical features of Excel that aid in powerful data analysis.
Pivot Tables
Pivot tables are a powerful tool for interactively and quickly grouping, aggregating, filtering, and visualizing data with simple drag-and-drop functionality and no formulas. They are easy to adjust as per the requirements, providing flexibility in analysis. Since pivoting highlights valuable information, it is fundamental to data analysis using Excel. A simple refresh will update all values when new data is added to the table you’re analyzing, ensuring that your insights are always up to date.
Select the data you want to work with and Insert -> PivotTable. You can check out the example pivot analysis here.
This feature, previously called “Ideas,” empowers you to ask questions in English and understand the data using natural query language. You don’t need to spend time writing complex formulas. Data analysis using Excel becomes much easier as visualizations are automatically displayed for the query you ask, using the best suitable chart to help you quickly interpret the data.
You can also see ‘Analyze Data’ under the Home tab. So, Excel will provide suggested questions, or you can type in a specific question.
For instance, It is a free add-on used to perform complex statistical or complex engineering analyses. So, You only need to provide the correct range of data on which you want the function to be applied. hence, You don’t need to know the underlying formulae. Excel will also select appropriate functions and display the results in tabular and/or graphical forms.
You need to load and activate the Toolpak using the File -> Options -> Manage -> Excel Add-ins.
There are numerous functions like correlation, descriptive statistics, smoothing, histogram, moving average, rank, regression, etc.
For instance, It is an Excel add-in that can be used for data discovery, cleansing, transforming, and combining data from different sources. It prepares data for further analysis. In this image, you can see Returns2. Returned is a column from another table.
Other Useful Excel Features to Analyze Data
Sort
You can sort data on multiple columns for analysis. In this example, since Salary is sorted in descending order within State sorted alphabetically. So, we can now compare data state-wise and salary-wise.
A Filter not only allows you to select data but also shows you the unique values, blank values if any.
Excel has many functions that help in data cleaning, sorting, analysis, and much more. Some common examples are:
| Function | Use | Syntax |
| COUNTBLANK() | Detect missing values and will give the count of blanks. | COUNTBLANK(range) |
| CONCATENATE() | Combine the values of several cells into one cell. | CONCATENATE(text1, [text2], …) |
| LEN() | Display the length of the string. | LEN(text) |
| SUMIFS(), MAXIFS(), AVERAGEIFS() | Perform sum, max, and average using a criterion. | SUMIFS(sum_range, criteria_range1, criteria1, [criteria_range2, criteria2], …) |
| RANK | Return the rank of a numerical value, which is vital during analysis to understand where the value falls in the range. | RANK(number, ref, [order]) |
| VLOOKUP/XLOOKUP | Combine data from multiple tables based on some common field. | XLOOKUP(lookup_value, lookup_array, return_array, [if_not_found], [match_model], [search_mode]) |
| IFERROR() | Replace the #VALUE errors with any text/value. Useful when displaying data to the end-user. | IFERROR(value, value_if_error) |
Conditional Formatting
Since you can visualize data using data bars, color variations, and icon sets depending on the cell’s value, data analysis using Excel becomes much more intuitive. In this figure, you can see some options for visualizing data with data bars. When dealing with large amounts of data, these tools are particularly helpful for emphasizing unusual values and identifying patterns, making it easier to draw meaningful insights and focus on critical trends.
For instance, You can use the built-in conditions or create your own. So, You can apply conditional formatting to a selected range of cells, an Excel table, or a pivot table.
You have the option in Data -> Remove Duplicates, and we can also choose the column names that we want to check for duplicate values. It is an essential task in data cleaning.
Creating data visualizations is very easy using Excel. Analyzing rows and rows of data is much easier with a chart! Excel provides a variety of charts for your analysis.
Techcanvass also offers many other professional courses, To know more about our IIBA Certification Courses visit our website.
Useful Links – Power BI Training | Data Analytics Fundamentals Course
Different Kinds of Data Analysis Using Excel
Excel tables also help to manage and analyze datasets systematically with headers and alternate shading or banding of rows. since, They have structured references and dynamic ranges, which aid in data analysis. so, You can convert data in Excel to a table by clicking any cell in the data and Ctrl + T.
What-if Analysis
What-If Analysis in Excel allows you to compare outcome results based on variable changes. The Goal Seek functionality helps by mathematically adjusting a single variable to reach the desired goal. There are many other features within this tool that enable you to test different scenarios and understand the potential impact of changes. You can find this option in the Data tab, making it a valuable tool for data analysis using Excel.
Final Remarks
Since, Many other tools in the market for much deeper analysis like Python and R, Tableau, and Power BI are available. But Excel won’t go away. So, For many people, Excel is the first tool they learn. hence, Its ease and flexibility give users a comfort level. So, Excel will be the go-to tool for many organizations and people starting their journey in analytics.