
Table of Contents
Overview
Are you preparing for a Data Analytics interview? We have consolidated the top 40 Data Analytics interview questions and answers in this article. This will help you get ready for the interview. We have divided the questions into categories for ease of learning.
General Data Analyst Interview Questions
These questions are general questions to check your Data Analytics basics.
1. What is Data Analytics?
Collecting data from different sources, cleaning it using various tools, technologies & algorithms, analysing and generating meaningful insights for business problem solving or improving customer experience/engagement or enhancing business growth is data analytics.
2. What is the difference between Analysis and Analytics?
Analysis and Analytics have more or less the same meaning & used in different contexts.
Analysis – Analysis is a collection of information/data, examining it carefully, finding out patterns, trends, and characteristics of the collected data and drawing some meaningful findings to take corrective measures or mitigate the risks. Usually, this is based on historical data to assess the current situation or the problem area. The data is broken down into small components and analysed carefully to drive business decisions.
Some examples are Root-Cause Analysis (RCA) using a fishbone diagram, customer sentiment analysis using NLP & ML models, employee attrition analysis to enhance retention using statistical models etc.
Analytics– Analytics is used in the broader sense where the data is collected systematically from various sources, pre-processing the data using statistical models/mechanisms and generating some sense out of this data for business decisions. This is not only based on historical data but also on existing/current data to train the models to predict, and forecast future trends and find out unfold opportunities for business growth.
There are four types of analytics:
1. Descriptive Analytics – Describes the current situation, trends & position of the organization compared with previous year/month results.
2. Diagnostic Analytics – This analytics is deep diving into the collected data and finding the reasons behind generated trends and why something happened in which event. This will help in assessing opportunities to improve.
3. Prescriptive Analytics – This analytics prescribes the data to take corrective measures to make progress or avoid a particular event in future.
4. Predictive Analytics – It uses Machine Learning models to predict future trends, events and outcomes. It uses historical & current data to forecast accurately for better business growth.
Some examples are Sales data analytics for future trends & forecasts, disease detection & prevention, resource optimization etc.
3. Why Data Analytics is important?
Want to learn Data Analytics with Live Project? Join our Data Analytics Training
In this digital world, huge data are being generated. Converting this raw data into meaningful actionable insights will help in detecting diseases, enhancing the organization’s operational efficiency & productivity, understanding customer preferences & serving them on time to have a competitive edge.
Looking into market trends & customer preferences, businesses can make informed decisions to adjust their offerings, and pricing and strategize spending.
In a nutshell, data analytics helps in making on-time, data-driven decisions!
4. What does a Data Analyst do?
Data Analyst:
- Collects & complies the data from various sources
- Pre-processing the data to remove null values, duplicates, format issues, errors and outliers to make data clean and good quality
- Does descriptive, diagnostic & prescriptive analysis of the data using statistical & ML models
- Develop reports/dashboards using visualization tools like PowerBI, Tableau or QlikView to generate insights
- Does predictive analytics based on the need or problem statement
- Communicate findings/results to stakeholders & leadership to make business decisions
5. Write some key skills usually required for a data analyst.
Key skills for data analyst:
- Python/R language
- SQL
- Excel (pivoting, formulas etc)
- Machine Learning
- Statistics
- Data Mining
- PowerBI / Tableau / QlikView
- Problem-Solving
- Critical Thinking
- Communication
- Domain knowledge like finance, e-commerce, banking, healthcare, Insurance etc
Checkout Our Data Analytics Course Page
Our Data Analytics Certification course does include a Job interview preparation module which prepares you for the interviews in a comprehensive manner.

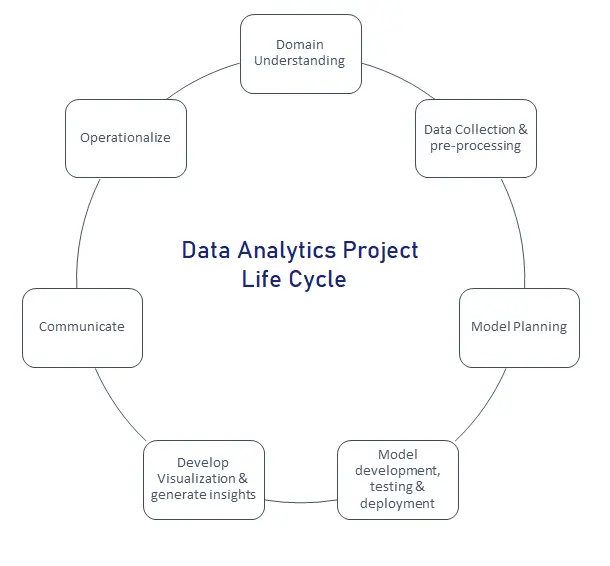
6. Explain to me the Data Analytics project lifecycle.
The Data Analytics Project Lifecycle is as below:
- Understand the domain
- Data Collection from different sources
- Data pre-processing
- Model planning
- Model development, testing & deployment
- Develop Visualization & generate insights
- Communicate
- Operationalize
Useful Link – Learn more about Data Analytics Lifecycle.
Data Analyst Interview Questions – Conceptual
7. What is Data wrangling? Why is it important?
Data wrangling is one of the steps in the data analytics project life cycle. It is a process of transforming the raw (structured & unstructured), messy & complex datasets into rightly formatted ones that are suitable for analytics & Machine Learning models to generate insights that are useful for fact-based and data-driven decision-making to help business growth.
It is very important to put a proper & right foundation for any of the development for analytics. Ensuring, the foundation-level dataset is correct in the right format for appropriate data analytics. The data wrangling helps to bring different source datasets into one useful format for cross-platform data analytics.
8. What is Data Profiling?
Data profiling in data analytics is a proactive approach to examining the transformed data, analysing it from various angles and creating useful summaries & trends around the data.
This process uncovers the metadata of data to determine its legitimacy, functional dependency, relationship and data quality to overcome the bad data that usually costs the organizations. The profiled information can be used to reduce small issues in data that may cause big problems in future.
9. How have you used Excel for data analysis in the past?
Microsoft Excel is one of the commonly used tools for data analysis. It has very user-friendly options to import the data from various sources and organize & transform the data that make sense for the data analyst. Analysts can do complex calculations & manipulate data using Excel functions & formulas. Users can sort, filter, and pivot the data based on the need for analysis. Excel has built-in visualization tools (charts and graphs) & statistical functions to generate patterns and trends helping to make informed decisions.
We have used Excel by connecting directly to data sources using OLED and ODBC connections. PostgreSQL tables are quite helpful in connecting to Excel for further analytics. PostgreSQL tables are where data is stored in a structured format. Each table consists of rows and columns, similar to a spreadsheet.
Useful Link – Master EDA with excel
10. What is the difference between Quantitative versus qualitative data analysis?
Quantitative data analytics is done on numerical/numbers using various mathematical calculations and statistical methodologies to find the patterns, trends and relationships between different features.
Some examples are financial data, ratings, clinical research, demographic data analytics etc.
Qualitative data analytics is around the examination & interpretation of non-numerical data to find out patterns, themes & senses of the data.
Some examples are case studies, surveys, interviews and feedbacks etc.
11. What are the steps involved when working on a data analysis project?
Below are the key steps in a successful data analysis project.
- Understand domain & problem statement
- Find data sources and data collection
- Data cleaning & transformation
- Exploratory data analysis using descriptive analysis, visualization & metrics generation
- Statistical analysis & hypothesis calculations
- Interpretation & Insights
- Communication with leadership on insights
- Documentation of the whole process
- Iterative improvements (continuous improvement)
Data Analyst Interview Questions – Statistics
12. What statistical methods have you used in data analysis?
Statistical methods are an important aspect of data analysis for consolidating, summarizing the data, and finding the sense of the analysed data. We used a few methods as below:
- Hypothesis Testing – This is to find out the relationship or difference between the attributes/features. Common tests like Chi-square, t-test & correlation coefficient tests are useful.
- Descriptive Statistics – To get the insights w.r.t. central tendency, dispersion, and distribution of the data, descriptive statistics is important. We used mean, median, mode, variance, standard deviation, range, and percentiles while working on it.
- Regression Analysis – Helps to find the relationship between one or more independent features and dependent features. Some examples are linear regression, logistic regression, polynomial regression etc.
- Time-series Analysis – Helps to analyse the data that is collected over time to find patterns, trends, and seasonal behaviour.
- Cluster Analysis – This is to group similar kinds of objects & features w.r.t. behaviours and characteristics. Some examples are k-means clustering, hierarchical clustering etc.
Useful Link – Training program designed to help you master skills that will enable you to work in Data Analytics Projects.
13. What is an outlier?
Outlier is a fraud, errored data, noisy data or rare-event data that is completely different from the regular or normal observations or datasets. They distort the usual patterns, and trends that lead to biased results or inaccurate insights/conclusions.
Some examples are:
1. Date of birth – 32nd May 2100
2. Age – 280 years
3. High temperature – 2000 ‘C
4. Revenue – $1
5. Height – 50 feet
14. How are outliers detected?
Outliers can be detected using various statistical methods & visualization tools.
Statistical methods – Mean, median, standard deviation, and quartiles are commonly used descriptive statistical methods to find outliers. Analysts can detect data points that fall far from the mean or median or beyond a certain threshold value.
Visualization tools – In PowerBI, Tableau & QlikView visualization tools, histograms, boxplots, and scatter diagrams are commonly used to detect outliers.
15. What is time series analysis?
Time series analysis is a statistical methodology to analyse the data that is collected over time to find patterns, trends and cyclical/seasonal behaviour that is going to help in decision making. The time intervals may be daily, weekly, monthly, quarterly and yearly.
Some examples are sales numbers, stock market trends, data centre temperature, sensor data and employee attendance or attrition.
16. Where is time series analysis used?
Time series analysis is used at various places. Some examples are:
- Sales data analysis for demand forecasting, budgeting and recruitment
- Stock price analysis for investments and withdrawals
- Demand forecasting for resource mobilization & budgeting
- Social media & survey data for sentiment analysis, trend analysis, and event triggers.
- Sensor data for preventive/predictive maintenance, anomaly detection and process improvement
- Monitoring and analysing environmental data for weather forecasting, and pollution monitoring/control
- Medical reports for the right diagnosis & clinical research
17. What are the types of hypothesis testing used today?
Hypothesis testing is to find out the relationship or difference between the attributes/features. The hypothesis test finds which statement is majorly supported by measured sample data to validate the results. There are two ways of doing hypothesis testing:
1. Null hypothesis – this test always predicts that there is a ‘null’ relation between attributes/features.
2. Alternate hypothesis – this test predicts that there is a relation between attributes/features.
These two hypotheses are mutually exclusive.
There are three types of tests as below:
1. Right tailed – to find out whether the parameter is greater
2. Left tailed – to find out whether the parameter is lesser
3. Two tailed – to find out whether there is a no-directional difference. Means, no greater or lesser.
Commonly used methods are Chi-square, t-test & correlation coefficient tests etc.
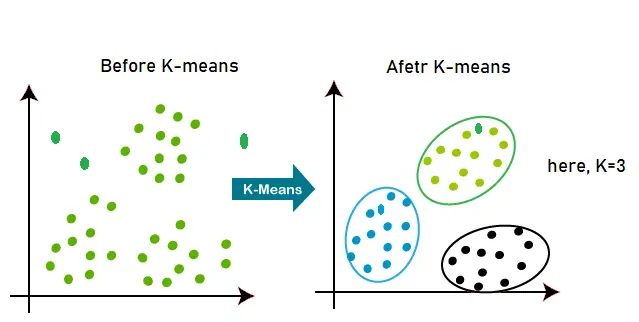
18. What is the K-means algorithm?
Clustering is an unsupervised learning algorithm that groups similar datasets into different clusters that are different from others. Unlike in ‘Classification’ where every dataset is labelled, clustering works on unlabelled datasets. K-means is one of the clustering methods. Here, K is the number of pre-decided clusters by the subject matter expert (SME) to have appropriate clusters in the process. If K=2, there will be 2 clusters, and for K=3, there will be 3 clusters.
Data Analyst Interview Questions – Career
19. What was your most successful/most challenging data analysis project?
In my current role, I have worked on one of the data analytics projects where App uninstallation was a major challenge. This has a direct correlation with App UX, app performance, customer sentiment, competition, offers, product quality & services. The key challenge in this project was working with a massive amount of unstructured data from various sources.
20. What is your plan after taking up this data analyst role?
Thanks for offering me to take this data analyst role! I am eager to use all my learnings and practical experience to solve business problems. I am continuously improving my capabilities and competencies to assist business users in getting valuable insights for making fast and data-driven decisions. I will align myself with your goals and objectives so that, I can start supporting quickly.
If there are any specific tools or areas where I should dive deep into them, please let me know. I will start looking into it. Thank you!
Data Analyst Interview Questions – SQL and Databases
21. Explain the different types of joins in SQL.
A JOIN is used to bring together data from two or more tables by utilizing a common column that is present in each table. We can use INNER JOIN, LEFT JOIN, RIGHT JOIN, and FULL OUTER JOIN. These JOIN variations are defined by the manner in which data from the involved tables is paired and retrieved.
22. How can you optimize the performance of a slow SQL query?
Indexing columns used in WHERE, JOIN, and ORDER BY clauses
– Optimizing database configuration and hardware resources
– Simplifying complex queries and reducing joins
– Using efficient data types and minimizing data size
– Avoiding SELECT *
23. What are the constraints in SQL? Please name a few.
Answer: A constraint in SQL defines rules or restrictions that apply to data in a table, ensuring data integrity. Common constraints include:
– PRIMARY KEY: Ensures the values’ uniqueness in a column
– FOREIGN KEY: Enforces referential integrity between tables
– UNIQUE: Ensures the uniqueness of values in a column
– CHECK: Defines a condition that data must meet to be inserted or updated
– NOT NULL: Ensures that there are no NULL values present in a column
24. There is a table having 4 columns, what query will you use to find duplicate rows in the table?
SELECT column1, column2, column3, column4, COUNT(*) AS duplicate_count
FROM table_name
GROUP BY column1, column2, column3, column4
HAVING COUNT(*) > 1;
25. How will you retrieve the top 10 customers by total sales from a table using SQL?
SELECT customer_name, SUM(sales_amount) as total_sales
FROM sales
GROUP BY customer_name
ORDER BY total_sales DESC
LIMIT 10
Useful Link – This course is to make you learn and understand the Basics of SQL
Data Analyst Interview Questions – Power BI
26. Can you explain the concept of measures and dimensions in Power BI?
Measures are numerical data that can be aggregated by applying mathematical calculations like SUM, COUNT, MAX, MIN etc.
– Dimensions are columns with categorical data used for filtering, grouping, or slicing data, these columns have categories which are repeated over multiple rows, for example, Region, Product Type, etc.
27. How will you create a calculated column in Power BI?
Go to the “Modeling” tab
– Click “New Column”
– Enter a formula using DAX (Data Analysis Expressions) language
– Press Enter to create the calculated column
28. How do you handle data modeling and relationships in Power BI?
Import and connect data sources (e.g., tables, files) in Power BI
– Define relationships between tables using keys (e.g., inner join)
– Use the “Modeling” tab to manage table relationships and data structure
– Optimize data models for performance and query efficiency
29. Can you walk me through your process for creating a dashboard in Power BI?
Determine the dashboard’s purpose and audience
– Choose relevant visualizations and arrange them logically
– Add filters, slicers, and drill-down capabilities as needed
– Customize colours, fonts, and layout for clarity and aesthetics
– Publish and share the dashboard with stakeholders
30. What is the difference between a table and a matrix visualization in Power BI?
Table: displays detailed data in a tabular format, just with rows and columns
Matrix: displays aggregated/summarized data in a grid format, with rows, columns, and subtotals
Useful Link – Master Power BI with this Power BI Certification course
Data Analyst Interview Questions – Tableau
31. How is a worksheet different from a dashboard in Tableau?
A worksheet in Tableau is a single view or chart, while a dashboard is a collection of multiple worksheets and objects (like images and web content) combined on a single page for interactive analysis.
32. Why do we have parameters in Tableau, and how can they be useful in data analysis?
The Parameter is a quick way of creating dynamic values that can be used to control various aspects of a visualization, such as filters, calculations, and reference lines. They allow users to create interactive and flexible dashboards that can be easily customized without having to edit the underlying data or calculations. Parameters can be used in several ways including filtering, what-if analysis, data modeling and taking user input.
33. How is blending different from joining in Tableau?
Joining your data can only be done when the data comes from the same source, for example from two sheet tabs within a single Excel file. If that same information was stored in separate Excel files you would need to do a data blend in Tableau. A blend is always required if the data is stored in two separate “data sources” within Tableau. So even if your data is very closely related and exists in two separate files or databases, you will have to do a data blend if you are combining the data in Tableau.
34. What is the Tableau Server, and how does it differ from Tableau Desktop?
Tableau Server is a web-based version of Tableau which is deployed on an on-premises server and used in larger teams for sharing and collaborating on Tableau workbooks and dashboards easily with the stakeholders. Tableau Desktop is a desktop application used for creating and publishing these visualizations to Tableau Server.
35. Explain the concept of LOD (Level of Detail) expressions in Tableau.
LOD expressions allow you to compute values at different levels of granularity than the view in your visualization. You can use FIXED, INCLUDE, and EXCLUDE LOD expressions for more complex aggregations.
Experience-based questions
36. Could you give an example of a time you had to solve a data problem?
I ran into a problem with inconsistent sales data between geographies in one of the earlier projects. I collaborated with the sales team to find a solution after using SQL to find the disparities. Additionally, in order to avoid such problems in the future, I put in place a data validation procedure.
37. How do you manage a data analysis project with competing priorities and short deadlines?
I manage expectations by communicating with stakeholders and prioritizing work according to their impact and urgency. To keep myself focused and organized, I also use project management software. I collaborated closely with the team to expedite the research and presentation process because I had to give insights for one project on time.
38. Have you ever dealt with combining multiple data sources to conduct analysis?
One of my previous works involved merging customer data from CRM with sales data in ERP and marketing data from social media platforms into one project. I used data integration tools to link the sources together and establish a warehouse to store the consolidated information. At this point, I also had to analyze the data to determine client clusters as well as create specific marketing campaigns.
39. Can you tell me about a time when you identified a key insight from data analysis that drove business decisions?
I once did a market basket analysis to find hidden patterns in customers’ purchasing behaviour by identifying that those who bought product A were more likely to buy product B. When I informed this fact to the product team, they in turn used it to develop a strategy that increased sales by 15%.
40. How would you explain complex data insights to non-technical stakeholders?
First step is to understand their needs and goals as well as I can. Then I put forth these insights using simple understandable language without jargon. Also, I use visualizations and storytelling techniques to make them more engaging and accessible. Finally, based on these findings, I provide recommendations and actionable steps.
Conclusion
The Interview questions for Data Analysts provide you with a solid foundation for facing such an interview. The answers have been provided by a Data Analytics professionals. Please note that you need to answer the questions in your own words so that the answers sound natural.
If you would like to expand your knowledge and deep dive into analytics, you can join our Data Analytics Training, Power BI Training or IIBA CBDA Certification Course.

