Power BI Interview Questions
and Answers (2026)
Power BI interview questions can feel endless when you start preparing. Some interviewers ask simple things like what a dashboard is, while others go deep into DAX, data models and Fabric. This page brings together the most common Power BI interview questions and answers, so you can prepare in a clear order.
Start Practising
You will find questions for freshers and beginners, report design and visualization questions, questions by job role and experience level, questions by topic such as SQL, DAX, Power Query, data modeling and Power BI Service, newer questions on Fabric and Copilot, and a few project and scenario based questions. Every question has a short answer in simple words, so you can understand it first and then say it in your own style.
Power BI Interview Questions and Answers for Freshers and Beginners
Every interview starts somewhere. These are the questions almost every Power BI interview opens with, so get these right and the rest gets easier.
1What is Power BI?
Power BI is a business intelligence tool from Microsoft. It connects to your data, helps you clean and organise it, and then turns it into reports and dashboards that people can explore, filter and share. Companies use it to track sales, costs, customers and many other numbers in one place. For a quick overview, read our guide on Power BI: introduction, key features and importance.
2What are the main components of Power BI?
Power BI Desktop is the free Windows app where you build reports. Power BI Service is the online part where you publish, share and manage them. Power BI Mobile lets you view reports on a phone or tablet. A gateway connects on premises data to the Service, and Power BI Report Server is used by companies that want to keep reports on their own servers.
3What is the difference between Power BI Desktop and Power BI Service?
Power BI Desktop is where you do the building work. You connect to data, clean it in Power Query, create relationships, write DAX and design visuals. Power BI Service is where you publish that work so others can use it. In the Service you can share reports, set up scheduled refresh, create dashboards and manage who can see what.
| Aspect | Power BI Desktop | Power BI Service |
|---|---|---|
| What it is | Free Windows application | Online (cloud) service |
| Main purpose | Build reports and data models | Publish, share and manage content |
| Typical work | Power Query, relationships, DAX, visuals | Scheduled refresh, dashboards, apps, workspaces, security |
| Used by | Report developers | Developers, managers and report viewers |
Basic report editing is possible in the Service, but heavy modeling work is usually done in Desktop.
4What is the difference between a report and a dashboard?
A report has one or more pages of visuals and is built on one semantic model. You can click, filter and drill into it. A dashboard is a single page made of tiles, and those tiles can come from many different reports. Dashboards are created only in Power BI Service. For example, a sales manager may open a dashboard every morning to see today’s sales, and click a tile to land in the full report for details.
5What is a semantic model in Power BI?
A semantic model, earlier called a dataset, is the data layer behind your reports. It holds the tables, relationships, measures and connection details. Many reports can use the same semantic model, which helps keep numbers consistent across a team. Interviewers may still say dataset, so be ready to use both names.
6Which data sources can Power BI connect to?
Power BI can connect to Excel, CSV and text files, databases like SQL Server, Oracle and MySQL, cloud sources like Azure, SharePoint and OneDrive, web pages and APIs, and online services like Salesforce and Google Analytics. It has a large number of built in connectors, so most business data can be brought in.
7What is Power Query?
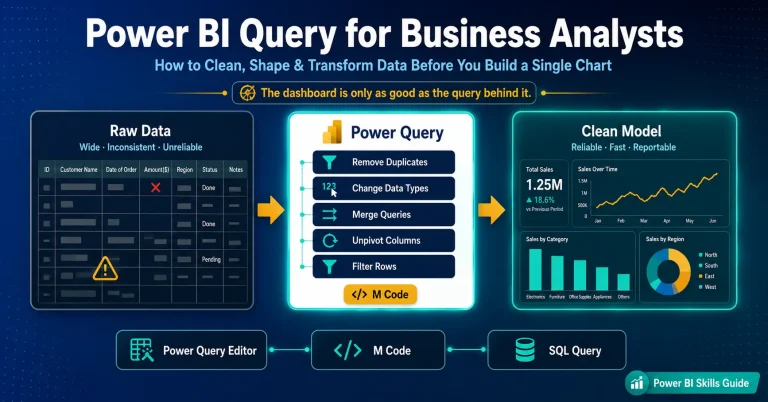
Power Query is the tool inside Power BI for getting and cleaning data before it loads into the model. You can remove duplicates, fix data types, split columns, merge or append tables and unpivot data, mostly with clicks. Every step is saved and runs again on each refresh. Behind the scenes it uses a language called M. If you want to go deeper, read our guide on Power BI query for business analysts.
8What is DAX?
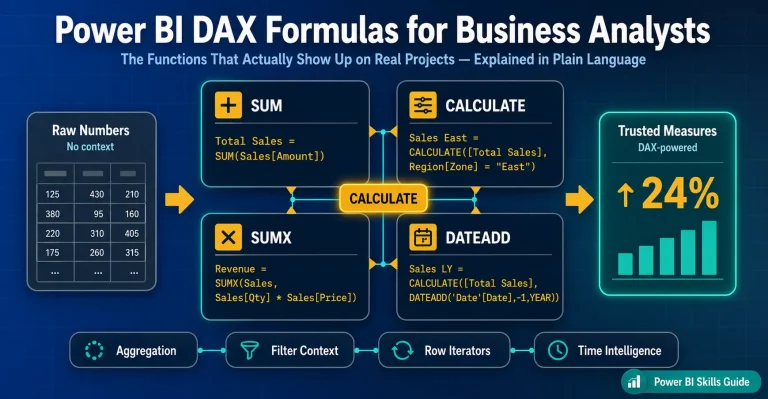
DAX stands for Data Analysis Expressions. It is the formula language used to create measures, calculated columns and calculated tables. It looks a bit like Excel formulas, but it works on whole tables and follows the relationships in your model. For example, the measure below gives the total of the Amount column. Our guide on Power BI DAX formulas for business analysts covers the most used ones.
Total Sales = SUM(Sales[Amount])9What are relationships in Power BI?
A relationship connects two tables using a common column, for example CustomerID in both a Sales table and a Customers table. Once they are connected, a filter on one table flows to the other. The most common type is one to many, where one customer can have many sales. The other types are one to one and many to many.
10What are the different types of filters in Power BI?
Power BI has filters at three main levels. A visual level filter affects one chart, a page level filter affects every visual on that page, and a report level filter affects all pages. There is also a drill through filter, which takes you to a detail page for the item you selected.
11What is the difference between a slicer and a filter?
A slicer is a visual placed on the report page that viewers can click to filter the data. A filter sits in the Filters pane and is usually set by the report author. Use slicers for choices readers will use often, like year, region or product.
12What is a gateway in Power BI?
A gateway is a bridge between data stored inside your company network, like a local SQL Server, and Power BI Service. Without it, the Service cannot reach that data for scheduled refresh. There are two types: the standard gateway for teams, and a personal mode for one user.
13What is a workspace in Power BI?
A workspace is a shared space in Power BI Service where a team keeps its reports, dashboards and semantic models. People get roles such as Admin, Member, Contributor and Viewer, and these roles decide what each person can do. For example, a finance team can keep all its monthly reports in one workspace, with the finance lead as Admin and the analysts as Contributors.
14How is Power BI different from Excel?
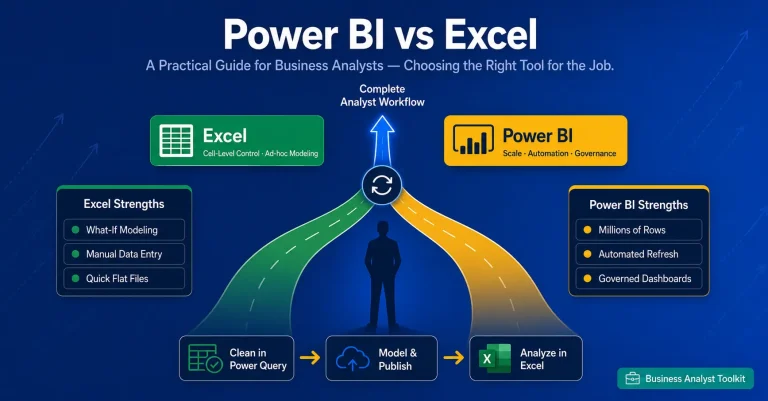
Excel is great for quick analysis and small to medium data, but one sheet is limited to about one million rows. Power BI can handle much larger data, builds relationships between tables, offers interactive dashboards, refreshes on a schedule and is easier to share with many people. Many analysts use both, with Excel as a data source and Power BI for reporting. You can read more in our Power BI vs Excel guide.
| Aspect | Excel | Power BI |
|---|---|---|
| Best for | Quick analysis, small and medium data | Interactive reporting on larger data |
| Data size | About 1 million rows per sheet | Much larger models |
| Relationships between tables | Limited (Data Model needed) | Built in |
| Sharing | Files sent around | Published online, with access control |
| Refresh | Mostly manual | Scheduled refresh |
15How is Power BI different from Tableau?
Both are strong business intelligence tools. Power BI works closely with Excel, Teams, Azure and other Microsoft tools, so people with a Microsoft background pick it up quickly. Tableau is known for very flexible visuals. Which one a company uses often depends on the tools and budget it already has.
Power BI Visualization and Report Design Interview Questions
Report design questions are common for analyst roles. Interviewers want to see that you can pick the right visual and make a report easy to read.
16What is the difference between drill down and drill through?
Drill down moves within the same visual through the levels of a hierarchy, for example Year to Quarter to Month. Drill through takes the user to a different page with details about the selected item, for example from a region bar to a page about that region’s customers. Drill down changes the level of detail, and drill through changes the page.
17What are bookmarks in Power BI?
A bookmark saves the current state of a report page, including filters, slicers and which visuals are visible. You can link bookmarks to buttons, so that a click switches between a chart and a table, or moves through a story step by step.
18What are tooltips and report page tooltips?
A tooltip is the small box that appears when you hover over a visual. A report page tooltip is a small page you design yourself, with its own visuals, that appears on hover. For example, hovering over a product bar can show that product’s monthly trend.
19What is conditional formatting?
Conditional formatting changes colours, data bars or icons based on values or rules. For example, sales below target can show in red and sales above target in green. The rule can also be based on a measure.
20How do you choose the right chart for your data?
I start from the question the viewer wants answered. Bar or column charts compare categories, line charts show trends over time, scatter charts show the relationship between two numbers, maps show locations and cards show one key number. Pie and donut charts only work for a few parts of a whole. I keep colours and visuals few, so that the main message is clear.
21What is the difference between a table and a matrix visual?
A table shows flat rows and columns. A matrix works like an Excel pivot table, with groups on rows and columns, subtotals and the option to expand or collapse levels. Use a table for a simple list and a matrix when you need to compare values across two dimensions.
22What is a KPI visual and how is it different from a card?
A card shows a single number. A KPI visual shows a value against a target, along with a trend and a colour indicator. It needs a base measure, a target and a trend axis such as date.
23What are custom visuals in Power BI?
Custom visuals are extra visuals from Microsoft AppSource, or built by developers, such as a Gantt chart or a word cloud. Certified visuals are checked by Microsoft. Some companies restrict custom visuals, so the admin settings matter.
Practise These Answers on a Real Power BI Project
Reading answers helps. Building dashboards, models and DAX measures with guidance helps more. The Techcanvass Power BI course takes you through live projects, so you walk into the interview with real examples to talk about.
Commonly Asked Power BI Interview Questions and Answers by Roles and Experience Level
Most role based questions are scenario based, so interviewers want to hear how you would handle a real situation. Use a short example from your own work wherever you can. The questions below are grouped from entry level to senior level, so you can start with your own experience range.
Power BI Data Analyst (0 to 4 years)
3 questions24You have to build a dashboard with data from various sources, but part of the data is inconsistent. What do you do about the inconsistencies?
First I find where the differences are, such as different spellings, date formats or codes for the same thing. For example, the same city may appear as Pune, pune and PUNE. I fix this in Power Query by cleaning the text, correcting data types and mapping values with a lookup table. Then I check my totals against the source and share the cleaning rules, so the business agrees on how the data was handled.
25What is the difference between a calculated column and a measure in Power BI?
A calculated column is worked out row by row when the data refreshes and is stored in the model, so it uses memory. A measure is worked out when a visual uses it and changes with the filters. Use a column when you need to slice or filter by the value, and a measure for totals, ratios and percentages.
| Aspect | Calculated column | Measure |
|---|---|---|
| When it is calculated | At data refresh, row by row | When a visual uses it, based on filters |
| Stored in the model | Yes, uses memory | No, calculated on demand |
| Changes with slicers | No | Yes |
| Best used for | Slicing, filtering, grouping | Totals, ratios, percentages |
26You have a slow Power BI report. How would you make it faster?
I start with Performance Analyzer to find the slowest visual. Then I remove columns and rows the report does not need, reduce the number of visuals on a page, simplify heavy measures and check that the model is a clean star schema. If the source supports it, I also use query folding or aggregations. For example, a main page with twenty visuals often becomes much faster when it is cut down to the eight that people actually use.
Senior Power BI Data Analyst (4 to 8 years)
3 questions27How would you implement Row Level Security for multiple user groups?
I create roles in Power BI Desktop with DAX filters, for example one role per group such as Region equals North. When there are many groups, I prefer dynamic security. I keep a table that maps each user email to the data they can see, and use one role that reads the signed in user. After publishing, I add people or groups to the roles in Power BI Service and test with the View as option.
28A stakeholder wants a report that updates in real time. How would you approach this requirement?
First I ask what real time means for them, seconds or a few minutes. For a few minutes, DirectQuery with automatic page refresh usually works. For true streaming data, such as sensor or app events, I would use Real-Time Intelligence in Microsoft Fabric. The older Power BI streaming and push datasets are being retired, and creating new ones will not be supported after 31 October 2027, so I would not start a new solution on them. I also explain the cost and speed trade off, because the faster the refresh, the heavier the load on the source.
29Explain a complex DAX function you have written and its impact on a business scenario.
Pick one real measure and explain it in this order: the business question, the formula in plain words, and what changed because of it. For example, I wrote a measure that listed customers who bought last year but not this year, using CALCULATE and a filter on the previous year. The sales team used it to contact lost customers, which gave them a clear action list every month.
Power BI Data Engineer (0 to 4 years)
3 questions30How do you design an efficient star schema model for Power BI?
I keep one fact table in the middle with numbers and keys, and connect it to small dimension tables such as date, product, customer and region. Each relationship is one to many, from the dimension to the fact, with a single filter direction. I avoid linking dimensions to each other, hide key columns and add a proper date table.
31You need to extract and transform data from multiple sources. What approach do you take in Power Query?
I connect to each source in its own query and clean it separately, removing extra columns, fixing data types and trimming text. For example, orders may come from SQL Server, targets from Excel and customers from a CRM export. Then I use Merge or Append to combine them. I keep steps that can fold back to the source first, name every query clearly, switch off loading for staging queries and use parameters for server names and file paths.
32Explain the difference between DirectQuery and Import mode and when to use each.
Import copies the data into the Power BI model. It is fast, but the data is only as fresh as the last refresh, and the model has a size limit. DirectQuery leaves the data at the source and sends a query each time, so data is fresh but reports can be slower. I choose Import by default, and DirectQuery when the data is very large or must be close to real time.
| Aspect | Import | DirectQuery |
|---|---|---|
| Where the data lives | Copied into the Power BI model | Stays at the source |
| Speed | Fast | Depends on the source and the query |
| Data freshness | As fresh as the last refresh | Close to live |
| Size limit | Model size limit applies | Handles very large sources |
| Use when | Default choice for most reports | Data is huge or must be near real time |
Senior Power BI Data Engineer (4 to 8 years)
3 questions33How do you optimize performance for a dataset with millions of records?
I load only the columns and rows the report needs, use the right data types and reduce columns with many unique values, for example by splitting a date time column. I use a star schema, incremental refresh and aggregation tables. When the data is in Fabric, I also look at Direct Lake.
34Explain the process of implementing incremental refresh in Power BI.
In Power Query I create two date time parameters named RangeStart and RangeEnd and filter the date column with them. Then I set the policy in Power BI Desktop, for example store five years of data and refresh only the last seven days. After publishing, the first refresh loads everything, and later refreshes load only the recent part. The source should support query folding for this to work well.
35What strategies would you use to integrate Power BI with a cloud based data warehouse?
I connect with the right connector for the warehouse, such as Azure Synapse, Snowflake, BigQuery or a Fabric warehouse. I choose Import, DirectQuery or Direct Lake based on data size and freshness. I create clean views in the warehouse for Power BI to read, keep heavy transformations inside the warehouse and use a service account for connections.
Power BI Architect (8 plus years)
3 questions36How would you design an enterprise wide Power BI architecture ensuring security and scalability?
I use a layered setup. Shared and certified semantic models sit in a central place, reports connect to them, and separate workspaces are used for development, testing and production. I add Row Level Security and sensitivity labels, size the capacity for the expected load and set up monitoring so problems are seen early. For example, ten regional teams can build their own reports on one certified sales model, so every region sees the same numbers.
37What strategies do you use to enforce data governance across multiple Power BI workspaces?
I set naming standards and clear owners for every workspace, and promote or certify trusted semantic models. I use tenant settings, sensitivity labels and the lineage view to track where data comes from. I also check usage reports, so unused content can be reviewed and removed.
38How do you manage Power BI performance at an enterprise scale?
I make sure the capacity is the right size and watch its usage metrics. I reuse shared semantic models instead of many copies, use incremental refresh and aggregations, and schedule heavy refreshes outside busy hours. I also train developers on best practices and review slow reports with Performance Analyzer.
Frequently Asked Power BI Interview Questions and Answers by Categories
These questions are grouped by topic, so you can revise one area at a time.
Power BI Report Building and Performance Questions
5 questions39You have to create a Power BI dashboard for executive reporting. How would you design it for usability, performance and data security?
For usability, I ask which decisions the executives make, then show five to eight key numbers at the top as cards with a comparison to target. Details go on drill through pages. For performance, I keep visuals few and the data summarised. For security, I apply Row Level Security where needed and share the report through an app with proper roles.
40A stakeholder is complaining about slow performance of the dashboard. What would you do to troubleshoot and enhance its performance?
I first open the report myself and find the slow page. Then I use Performance Analyzer to see whether the time goes to the DAX query, the visual drawing or something else. I fix the cause: rewrite heavy measures with variables, cut extra visuals, remove unused columns, or tune the source for DirectQuery. For example, a slow card visual often turns out to be one measure that loops over the full sales table. At the end I tell the stakeholder what changed.
41Your report should facilitate updates to real time data. How would you do this in Power BI?
I pick the simplest option that meets the need. Automatic page refresh on a DirectQuery model works for data that changes every few seconds or minutes. Real-Time Intelligence in Microsoft Fabric suits event data such as sensors or app logs. The older Power BI streaming and push datasets are being retired, so I avoid them for new projects. If near real time is enough, an Import model with frequent scheduled refresh is easier and cheaper.
42What would you do to accommodate changes in the data sources in an already existing Power BI report without breaking the existing visuals and measures?
I update the source step in Power Query and keep the final column names the same as before, renaming new columns back to the old names if needed. If the source location changes, I use parameters so I only change it in one place. I work on a copy first, check that all measures still work, and move the update through a deployment pipeline if one is available. For example, if a column called Amt becomes Amount at the source, I rename it back to Amt in Power Query, and no visual breaks.
43What are various ways in which Power BI reports can be shared considering data security?
You can share a report directly with people who have access, or publish an app from a workspace for a wider group. You can also embed reports in Teams or SharePoint, or send exports and subscriptions as PDF or PowerPoint. Row Level Security and sensitivity labels control what each person sees. Publish to web should be used only for public data, never for private company data.
SQL Interview Questions for Power BI Roles
5 questions44You have to fetch the second highest salary from a table without TOP or LIMIT. How would you construct the query?
One simple way finds the highest salary first, then the highest one below it.
SELECT MAX(Salary) AS SecondHighestSalary
FROM Employees
WHERE Salary < (SELECT MAX(Salary) FROM Employees);
Another way is to use DENSE_RANK ordered by salary in descending order and pick rank two. This also works for the third or fourth highest.
SELECT DISTINCT Salary
FROM (
    SELECT Salary, DENSE_RANK() OVER (ORDER BY Salary DESC) AS rnk
    FROM Employees
) t
WHERE rnk = 2;45How would you improve a lengthy SQL query that is taking a long time to run?
I read the execution plan to see where time is spent. Then I select only the columns I need instead of using SELECT *, filter early with WHERE, and add indexes on the columns used in joins and filters. I avoid wrapping indexed columns in functions, and replace repeated subqueries with a CTE or a temporary table.
46A Power BI report needs dynamic filtering depending on user roles. How would you do it with SQL?
I keep a security table that maps each user to the data they can access, such as regions. For DirectQuery, the database can apply Row Level Security using the signed in user. For Import mode, I bring the same mapping table into Power BI and apply the filter with Power BI Row Level Security, since the data is no longer read live from the database.
47Describe how to manage missing data in SQL when prepping datasets for Power BI reports.
I first find missing values with IS NULL. Then I decide for each column: replace with a default using COALESCE, such as 0 or Unknown, remove the rows, or leave them as null when missing has a meaning. I avoid turning missing values into zero for things like averages, because it changes the result, and I document the choice.
48How would you structure a Power BI reporting optimized data warehouse schema?
I use a star schema with fact tables for events like sales and dimension tables for date, product, customer and region. Each table gets a simple key, and the date dimension is built once and reused. I create views for Power BI, use consistent names, and add summary tables for very heavy reports.
Power BI DAX Interview Questions
11 questions49What would you type in a DAX formula to compute a year over year growth rate in a Power BI report?
First I create a measure for last year’s sales using SAMEPERIODLASTYEAR on a proper date table. Growth is this year’s sales minus last year’s sales, divided by last year’s sales. I use DIVIDE for the last step, so the result is blank instead of an error when last year has no sales. Then I format the measure as a percentage.
Sales LY = CALCULATE([Total Sales], SAMEPERIODLASTYEAR('Date'[Date]))
YoY Growth % = DIVIDE([Total Sales] - [Sales LY], [Sales LY])50What is the difference between FILTER() and CALCULATE()? Give a real world example of when to use each.
CALCULATE changes the filters under which a calculation runs. FILTER goes through the rows of a table and returns only those that meet a condition. For a simple condition, CALCULATE alone is enough. When the condition needs a measure, such as customers whose sales are above 1000, I use FILTER inside CALCULATE.
Red Sales = CALCULATE([Total Sales], Product[Colour] = "Red")
Sales From Big Customers =
CALCULATE(
    [Total Sales],
    FILTER(VALUES(Customer[CustomerID]), [Total Sales] > 1000)
)51How would you implement a running total in DAX that is reset by year?
The easiest way is TOTALYTD. It adds up sales from the start of each year to the current date and starts again when a new year begins. It needs a proper date table that is marked as the date table in the model.
YTD Sales = TOTALYTD([Total Sales], 'Date'[Date])52Describe how you would optimize a slow running DAX measure in a large data set.
I find the slow measure with Performance Analyzer and DAX Studio. Then I use variables so values are calculated once, avoid looping over a large table when a simple SUM works, filter columns instead of whole tables, and use DIVIDE. If the logic does not need to change with filters, I move it to Power Query or the source.
53What do you do to implement dynamic row level security with DAX in Power BI?
I create a security table with user emails and the values they can see, such as region, and connect it to the right dimension. Then I create one role with a filter that compares the email column to USERPRINCIPALNAME(). Every user now sees only their own rows with a single role. I test it with the View as option before publishing.
[Email] = USERPRINCIPALNAME()54What is the difference between SUM and SUMX?
SUM adds up one column. SUMX is an iterator: it goes through a table row by row, calculates an expression for each row and then adds the results. Use SUMX when the value needs a row level calculation, such as quantity multiplied by price.
Total Sales = SUMX(Sales, Sales[Quantity] * Sales[UnitPrice])55What are ALL, ALLEXCEPT and REMOVEFILTERS in DAX?
All three remove filters. ALL removes the filters from a table or columns. ALLEXCEPT removes every filter on a table except the columns you list. REMOVEFILTERS does the same job as ALL inside CALCULATE and reads more clearly. A common use is the percentage of total.
% of Total Sales =
DIVIDE([Total Sales], CALCULATE([Total Sales], ALL(Product)))56What is the difference between row context and filter context?
Filter context is the set of filters applied to a calculation by slicers, visuals, relationships and CALCULATE. A measure always runs inside a filter context. Row context means “the current row”, and it exists in calculated columns and inside iterator functions such as SUMX. A row context does not filter other tables by itself. CALCULATE can turn a row context into a filter context, which is called context transition.
57What does the RELATED function do?
RELATED brings a value from the one side of a relationship into the many side, when you are working row by row. For example, in a Sales table you can pull the product category from the Product table. It needs an existing relationship. RELATEDTABLE works in the other direction.
Product Category = RELATED(Product[Category])58Why do we use variables (VAR) in DAX?
Variables store a value once and reuse it, so the formula is easier to read and often faster, because the value is not calculated again and again. They also make a formula easier to debug.
YoY Growth % =
VAR CurrentSales = [Total Sales]
VAR LastYearSales =
    CALCULATE([Total Sales], SAMEPERIODLASTYEAR('Date'[Date]))
RETURN
DIVIDE(CurrentSales - LastYearSales, LastYearSales)59How do you create a date table and why do you need one?
Time intelligence functions such as TOTALYTD and SAMEPERIODLASTYEAR need a continuous date table. I create it with CALENDAR or CALENDARAUTO in DAX, or in Power Query, then add Year, Quarter and Month columns, mark it as the date table and connect it to the date column of the fact table.
Date = CALENDAR(DATE(2020, 1, 1), DATE(2026, 12, 31))Power Query Interview Questions
10 questions60How would you combine two tables in Power Query that have differing column structures?
I use Append. Power Query matches columns by name and fills the missing ones with null. Before appending, I rename columns so they match, remove extra columns and set the same data types. If I need to bring columns side by side from another table, I use Merge with a common key instead.
61How would you treat duplicate records in case of performing a data transformation in Power Query?
First I check whether the repeated rows are really duplicates. Then I select the key columns and use Remove Duplicates. If I need to keep a particular row, such as the latest one, I sort the data first so that row comes first. Table.Buffer can help keep that order stable.
62There is a dataset with dates in text form. How do you convert them to proper date formats in Power Query?
I change the type to Date, and when the format is different from my system settings I use the Using Locale option, so day and month are read correctly. For messy text, I split or clean it first and then convert. I check the Errors and replace or fix those values.
63Explain a scenario where you cleaned and normalized dirty data using Power Query prior to loading it into Power BI.
A good answer names the problem, the steps and the result. For example, a sales file had extra spaces, mixed city spellings, dates stored as text and blank rows. I trimmed and capitalised the text, mapped city names with a lookup table, converted the dates, removed blank rows and fixed the data types. The report then matched the finance totals.
64How would you design a dynamic parameter using Power Query to enable users to filter data prior to loading into Power BI?
I create a parameter in Manage Parameters, for example a start date or region, and use it in a filter step or in the source path. In Power BI Service, the value can be changed in the semantic model settings. For DirectQuery, M query parameters can be linked to a slicer field, so the user’s choice filters data at the source.
65What is the difference between Merge and Append in Power Query?
Append stacks tables on top of each other, so it adds rows. Use it for files with the same columns, such as monthly sales files. Merge joins two tables side by side using a key column, like a SQL join, and you choose the join type, for example Left Outer or Inner. Use it to add customer details to an orders table.
66What is query folding?
Query folding means Power Query turns your steps into one query that runs at the source, for example a SQL query, so the database does the heavy work. It makes refresh faster and is needed for incremental refresh to work well. You can right click a step and check View Native Query. Some steps break folding, so I place foldable steps such as filters and column removal first.
67What is unpivoting and when do you use it?
Unpivoting turns columns into rows. Spreadsheets often have one column for each month, which is easy to read but hard to filter in Power BI. After unpivoting, you get one column for Month and one for Value, which works much better in visuals and DAX. Our Power BI query guide shows an example.
68What is the difference between M and DAX?
M is the language of Power Query. It prepares and cleans the data and runs when the data refreshes. DAX is the language of the data model. It creates measures and calculated columns and runs when a report uses them. A simple way to say it is: prepare with M, analyse with DAX.
69What is the difference between Reference and Duplicate in Power Query?
Duplicate makes a full copy of a query with all its steps, and the copy is independent. Reference creates a new query that starts from the output of the original, so any change in the original flows into it. I use Reference when I want to create several tables from one cleaned source without repeating the cleaning steps.
Power BI Data Modeling Interview Questions
8 questions70You have a data set with several fact tables. How would you structure relationships to ensure they do not cause performance problems?
I share dimension tables such as date, product and customer across the fact tables, and connect each fact table to those dimensions with one to many relationships. I do not connect fact tables directly to each other. I keep filters in a single direction and write separate measures for each fact table.
71How would you make the decision between a star schema and a snowflake schema for Power BI data modeling?
I choose a star schema by default because it has fewer joins and is faster and simpler for Power BI. A snowflake schema may be fine when a dimension is very large or the source is already split into many tables. Even then, I often flatten it in Power Query to keep the model simple.
72Explain how to resolve circular dependencies in Power BI relationships.
A circular dependency appears when relationships form a loop, or when calculated columns depend on each other. I fix it by removing or deactivating one relationship, using USERELATIONSHIP in a measure when I need the inactive one, or reshaping the model into a star schema. I also replace calculated columns with measures or Power Query steps where possible.
73What is the best practice for optimizing data models to maximize Power BI performance?
I use a star schema, remove unused columns, set the correct data types and reduce columns with many unique values. I prefer measures to calculated columns, avoid two way filters unless needed, hide technical columns and use a proper date table. For very large data, I add aggregation tables.
74How would you create a many to many relationship in Power BI without affecting performance?
I add a bridge table that holds the unique values of the shared column, and connect both tables to it with one to many relationships. This is cleaner and faster than a direct many to many relationship. I keep the filter direction single and test the results to confirm the numbers are correct.
75What are cardinality and cross filter direction in a relationship?
Cardinality describes how rows in two tables match: one to many, many to one, one to one or many to many. Cross filter direction decides how filters flow. With a single direction, filters flow from the one side to the many side. With both directions, filters flow each way. I use single direction by default, because both directions can slow the model and create unclear results.
76What is a hierarchy in Power BI?
A hierarchy is an ordered set of related columns, such as Country, State and City, or Year, Quarter and Month. You create it in the model by dragging one field onto another. In a visual, it lets users drill down level by level.
77What is the difference between active and inactive relationships?
Between two tables, only one relationship can be active at a time. The others are inactive and shown as dotted lines. You can use an inactive one inside a measure with USERELATIONSHIP. A common case is a Sales table with both an Order Date and a Ship Date linked to one Date table.
Sales by Ship Date =
CALCULATE([Total Sales], USERELATIONSHIP(Sales[ShipDate], 'Date'[Date]))Power BI Service Interview Questions
7 questions78How do you schedule data refresh for a Power BI report that draws data from an on premises SQL Server?
I install an on premises data gateway on a machine that can reach the SQL Server and sign in with the right account. In Power BI Service, I connect the semantic model to the gateway, enter the data source credentials and set the refresh schedule. I also turn on failure notifications, so the owners know when a refresh fails. For example, a nightly refresh at 2 AM means the team sees fresh numbers when they start work.
79Describe the various licensing choices in Power BI Service and how they affect sharing and collaboration.
Free is for building reports in Power BI Desktop and for personal use. Pro lets people publish and share, and viewers also need Pro unless the content sits on a capacity. Premium Per User gives most Premium features to each user, and people who view that content usually need Premium Per User too. A Fabric capacity of F64 or above, or a Premium capacity, lets free users view content, but the authors still need Pro.
| Licence | What it allows | Who can view the content |
|---|---|---|
| Free | Build reports in Desktop, personal use | Only the owner |
| Pro | Publish and share in Power BI Service | Other Pro users |
| Premium Per User (PPU) | Most Premium features for each user | Other PPU users |
| Fabric capacity (F64 or above) or Premium capacity | Content hosted on dedicated capacity | Free users can view, authors need Pro |
Note: Licensing rules and prices change often. Check Microsoft’s current Power BI licensing page before your interview and say in the interview that you are going by the latest documentation.
80How do you provide data security in Power BI Service to limit access by roles?
I use workspace roles to control who can edit and publish, and Row Level Security to control which rows each person sees. I can also limit access to certain tables or columns with object level security. Sensitivity labels, app audiences and build permissions on semantic models add further control.
81You have to report externally to a client who is not licensed for Power BI. What are your options?
I can invite the client as a guest user, and depending on the licence, they may need their own or may be able to view content in a workspace on a Fabric F64 or Premium capacity. I can use Power BI Embedded to place reports inside a portal, where the app handles access. Another option is to send exports or email subscriptions as PDF or PowerPoint. I do not use Publish to web for private data.
82How do you deal with workspace permissions in Power BI Service for a big organization?
I give access to security groups from Microsoft Entra, not to individuals, and keep the number of admins small. I use the Admin, Member, Contributor and Viewer roles carefully, create separate workspaces for each team and each stage, and share finished content through apps. I also review access on a regular schedule. For example, when someone moves to another team, removing them from one group updates all their access at once.
83What is a Power BI app and how is it different from sharing a report directly?
An app is a packaged set of reports and dashboards that you publish from a workspace to a wider audience, with its own audience settings. Viewers get a clean, read only view, and changes appear only when the owner updates the app, so the author can keep working safely in the workspace. Sharing a report directly gives specific people a link and is fine for small groups, but it is harder to manage at scale.
84What are subscriptions and data alerts in Power BI Service?
A subscription sends a snapshot of a report page by email on a schedule, for example every Monday morning. A data alert notifies you when a value on a dashboard tile goes above or below a limit you set, such as daily sales dropping under a target.
Power BI Interview Questions on Microsoft Fabric and New Features
Power BI is changing fast, and interviewers have started asking about Fabric, Copilot and newer model features. Knowing these will help you stand out.
85What is Microsoft Fabric and how is it related to Power BI?
Microsoft Fabric is an all in one analytics platform that brings data engineering, data warehousing, real time analytics, data science and Power BI into one place. Power BI is now a part of Fabric, so reports can sit close to the data they use. For example, a company can keep raw sales data in a lakehouse, clean it with a dataflow, and build the Power BI report on top, all inside Fabric.
86What is OneLake?
OneLake is the single storage layer for all Fabric data in an organisation. You can think of it like OneDrive for data. Data is stored once and many tools can use it, so teams do not need to keep making copies.
87What is the difference between a lakehouse and a warehouse in Fabric?
A lakehouse stores structured and unstructured data as files and Delta tables, and is used with notebooks and Spark. A warehouse is built for structured data and works mainly with T-SQL. Both keep their data in OneLake, and Power BI can use either one.
88What is Direct Lake mode?
Direct Lake lets Power BI read data directly from Delta tables stored in OneLake. It does not copy the data into the model like Import, and it does not send queries to a source like DirectQuery. The aim is to give Import like speed with fresher data. It suits large tables that already live in a Fabric lakehouse or warehouse.
89What is Copilot in Power BI?
Copilot is an AI assistant inside Power BI. It can help create report pages, write summaries, suggest DAX and answer questions about your data. It needs a paid Fabric capacity (F2 or higher) or a Premium capacity (P1 or higher), and your admin has to turn Copilot on for the organisation. Trial capacities do not support it, and a Pro or Premium Per User licence alone is not enough. Copilot’s requirements change often, so check Microsoft’s current documentation before your interview. You can also read our article on Power BI Copilot vs manual reporting.
90What are calculation groups?
Calculation groups let you create a set of reusable calculations, like Year to Date, Month to Date and Prior Year, and apply them to many measures. You do not have to write a separate measure for every combination, which keeps the model small and tidy.
91What are field parameters?
Field parameters let report users choose which measure or column is shown in a visual using a slicer. For example, the same chart can switch between Sales, Profit and Quantity, so you do not need three separate charts.
92What is a composite model?
A composite model mixes storage modes in one model, for example some tables in Import mode and others in DirectQuery. It also lets you combine data from more than one semantic model. It gives flexibility, but needs careful design to keep the report fast.
93What are deployment pipelines?
Deployment pipelines help you move Power BI content through Development, Test and Production stages. You can compare stages, deploy with a click and keep changes under control. For example, a developer fixes a report in Development, the tester checks it in Test, and only then does it reach the business users in Production. They usually need a workspace on Premium or Fabric capacity.
94What are dataflows and when do you use them?
Dataflows are Power Query transformations that run in the cloud and can be reused. If many reports need the same cleaned customer data, you build it once in a dataflow and everyone connects to it. In Fabric, Dataflows Gen2 can also load the output into a lakehouse or warehouse.
95What is a Power BI Project (PBIP) file?
A Power BI Project saves your report and model as a folder of text files, instead of one PBIX file. This works well with Git, so teams can track changes, review them and work together without overwriting each other.
Project Based and Scenario Based Power BI Interview Questions
Interviewers like to ask about real projects because they show how you think. Answer with a short story: the problem, what you did and what changed.
96Tell me about a Power BI project you worked on.
Keep your answer in four parts: the business problem, the data you used, what you built and the result. For example: “The sales team could not see weekly targets, so I connected the CRM and Excel data, built a model and a dashboard, and the team now reviews it every Monday.” Mention one challenge you solved, like slow refresh or messy data.
97How would you move a set of Excel reports to Power BI?
I first list the reports and the questions they answer. Then I bring the data in with Power Query, build one clean model, recreate the key numbers as measures and compare them with the Excel results. After that I publish to a workspace, train users and retire the old files.
98How would you roll out self service reporting in a company?
I would build a few trusted semantic models that users can connect to, set up workspaces and roles, and share simple guidelines for naming and design. I would also train users with real examples and keep a small support group, so reports stay accurate while people create their own.
99A report that loaded in five seconds now takes a minute. What do you check?
I check what changed: data size, new visuals or new measures. I use Performance Analyzer to find the slow visual, then look at heavy DAX, many visuals on one page, unused columns and the storage mode. Fixes usually include removing columns, simplifying measures and reducing visuals per page.
100Two reports show different totals for the same KPI. How do you find the cause?
I compare the semantic models behind both reports first, because different models often have different definitions. Then I check the filters, date ranges, relationships and refresh times. Once I find the difference, I fix it in one shared model so both reports use the same definition.
Power BI Roles, Projects and Skills at a Glance
Power BI Roles and Responsibilities
Power BI Data Analyst (0 to 4 years)
builds dashboards and reports, works with business teams and keeps numbers accurate.
Power BI Data Engineer (0 to 4 years)
manages data pipelines and models, improves ETL steps and report speed, often inside Microsoft Fabric.
Senior Power BI Data Analyst (4 to 8 years)
leads reporting projects, writes advanced DAX and turns numbers into business insights.
Senior Power BI Data Engineer (4 to 8 years)
tunes large models, sets up CI/CD and connects Power BI with cloud and on premises systems.
Power BI Architect (8 plus years)
designs complete solutions with governance, security and company wide adoption.
Nature of Power BI Projects
Migration projects
moving reports from Tableau, QlikView or Excel to Power BI.
Reporting projects
building dashboards that help people make decisions.
Self service projects
helping business users build their own reports from ready made datasets.
Web and app integration projects
placing Power BI reports inside web apps or other business applications.
Fabric and AI projects
moving work into Microsoft Fabric and using Copilot to speed up analysis.
Key Skills as per Roles
| Role | Key skills |
|---|---|
| Data Analyst | visualization best practices, basic DAX, data sources, relationships and report tuning. |
| Senior Data Analyst | advanced DAX, Row Level Security, refresh performance and Power BI Service. |
| Data Engineer | Power Query, star schemas, automated pipelines and incremental refresh. |
| Senior Data Engineer | advanced SQL, dataflows, Fabric and Azure, and security and compliance. |
| Architect | solution design, shared and certified models, governance and capacity planning. |
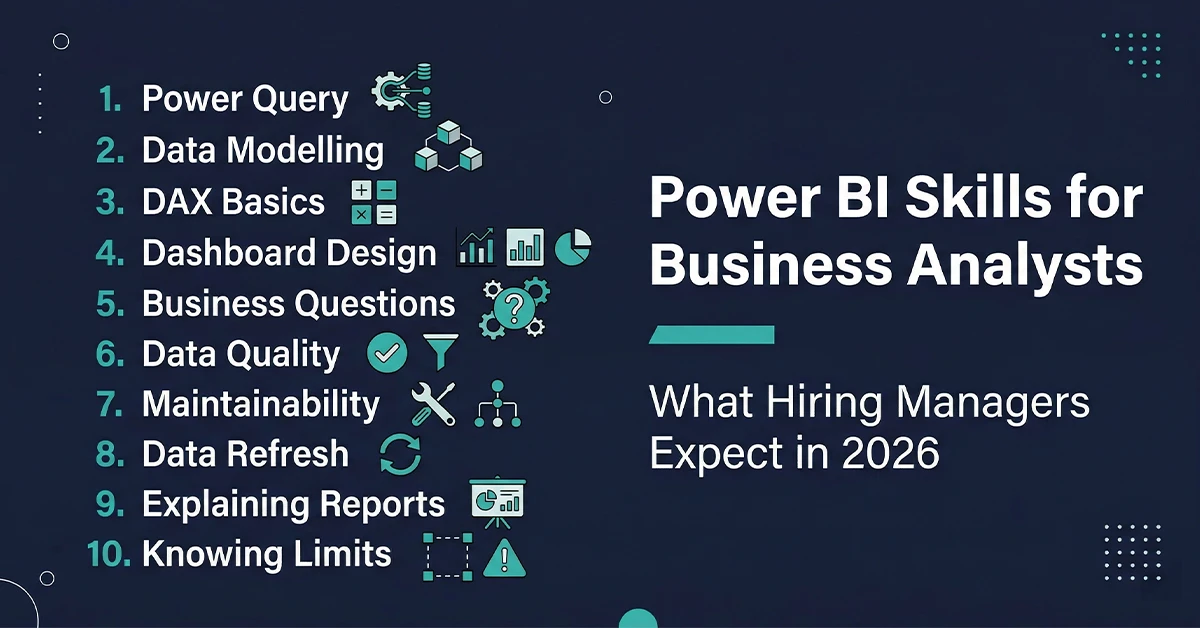
For a closer look at the skills hiring managers check, read our guide on Power BI skills for business analysts.
Power BI Interview Tips to Crack Them
Get the right certification
The Microsoft Power BI Data Analyst certification (PL-300) shows your skills and commitment to the field.
Practise on real projects
Building real dashboards from public data shows that you can use the concepts, not only read them.
Practise DAX on a real dataset
Writing a few measures yourself helps more than reading answers.
Keep one or two projects ready
Be able to explain the problem, your steps and the result.
Learn the basics of SQL and Power Query
Most roles use them together with Power BI.
Read about Fabric and Copilot
Newer questions will not surprise you if you know the basics.
Learn from the community
Microsoft Learn, forums and webinars help you keep up with new features.
Be honest
If you do not know an answer, say how you would find it. A clear and honest answer is valued more than a guess.
Keep One Real Project Ready for Your Interview
Interviewers ask about projects because they show how you think. Build yours with guided practice in the Power BI course from Techcanvass, then walk through it with confidence.
Frequently Asked Questions
What are the most common Power BI interview questions?
What are Power BI interview questions for experienced candidates?
How should a fresher prepare for a Power BI interview?
Is DAX compulsory for a Power BI interview?
Is SQL needed for Power BI jobs?
Which Power BI certification should I take?
How long does it take to prepare for a Power BI interview?
Conclusion
Clearing a Power BI interview takes strong technical skills, problem solving ability and good business sense. Start with the basics, learn your role and its skills, then move to DAX, Power Query and data modeling, and finally the newer topics like Fabric and Copilot. Practise each answer in your own words and keep a real project ready to talk about. If you also have a business analyst interview coming up, see our business analyst interview questions and answers. If you want guided practice with live projects, you can explore the Power BI course from Techcanvass.