Last Updated on September 18, 2025 by Techcanvass Academy
Table of Contents
Overview
In the current wave of data, to stay ahead in the curve, a business needs to master those tools that businesses use to make smart decisions. Enter Power BI-a powerful, dynamic tool dramatically changing the way companies analyze and see their data. But is it really worth learning? With the latest innovations that Microsoft has been researching, from breakthroughs in Microsoft Fabric, Power BI has evolved beyond just charts and dashboards. So, why should you invest your time in mastering this tool? Whether you seek to boost your career, future-proof your skills, or tap into growing demand for data analytics, here are 5 reasons why Power BI might be your best move yet.
Continuous Leader in Business Intelligence
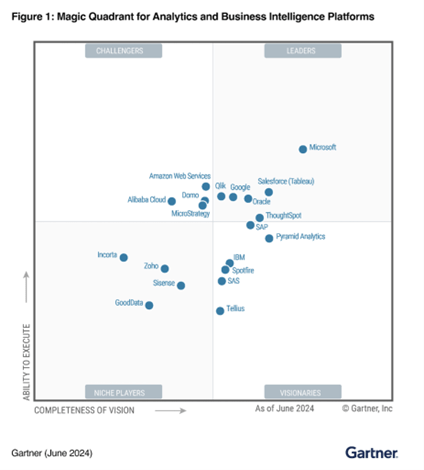
For the seventeenth consecutive year, Gartner has positioned Microsoft as a Leader in the 2024 Gartner Magic Quadrant for Analytics and Business Intelligence Platforms. The same report also shows that Microsoft, for the sixth consecutive time, is placed furthest to the right for Completeness of Vision and also highest in the Ability to Execute in the Magic Quadrant.

Useful Links – Introduction to Power BI | Power BI Course
While Power BI is certainly very popular, there are a host of other BI tools available. This includes the likes of Tableau, QlikView, and Looker. Here’s a brief comparison:
Tableau: For data visualization specialists, Tableau is more preferred. It features rich visualizations with highly interactive dashboards. However, it does come at a price greater than Power BI.
QlikView: Provides powerful data discovery and analytics capabilities but is not as user-friendly as Power BI
Looker: Mainly data exploration and, for companies already invested in Google’s ecosystem, makes even more sense.
While each has its plus side, Power BI stands head and shoulders among the options for Microsoft products integration, affordability, and ease of use.
Continuous Product Evolution
Power BI was released in 2015, and within this short term, it has evolved from just a visualization tool to become the end-to-end business intelligence platform. It’s testimony to the product team working hard to bring the best features. Power BI Desktop receives monthly updates. Last year in 2023, they launched Microsoft Fabric which is a full analytics platform that reimagines how different teams work with data by bringing everyone together with tools for every data professional. Fabric brought the power of Azure Synapse Analytics and Azure Data Factory to Power BI in a single, unified software-as-a-service (SaaS) platform. With Fabric, analysts and business users can now work closely with data engineers, data warehousing professionals, data scientists, and other data professionals-who are all working in the same SaaS experience and from the same unified data lake, OneLake-to discover insights.
Solid Future Roadmap
Microsoft Fabric and Power BI have a robust future roadmap focused on enhancing AI capabilities, real-time analytics, and seamless data integration to drive advanced data insights
Future Power BI Features:
- AI Integration:
- Copilot in mobile apps for AI-driven insights.
- AI summaries in report subscriptions.
- Advanced Reporting:
- Path layer for Azure Map Visual.
- Visual calculations within reports.
- Small multiples for new card visual.
- Modeling & Data Connectivity:
- Metric sets in Microsoft Fabric.
- Live edit of semantic models in Direct Lake Mode.
- Connected tables integration with Excel.
- UI & Visualization:
- Dark mode in Power BI Desktop.
- Streamlined menu bar in service view.
- Mobile & Accessibility:
- NFC tag support for mobile reports access.
Future Microsoft Fabric Features:
- Real-Time Intelligence:
- Support for parameters in triggers.
- Webhook integration for dynamic actions.
- Data Factory Enhancements:
- Expanded data connectivity options.
- Enhanced data transformations and activities.
- Real-time data replication to lakehouse.
- General Platform Updates:
- Unified roadmap with Power BI integration.
Easier learning curve
Power BI is often preferred by organizations looking for a quicker ramp-up time, especially if they’re already using Microsoft products.
|
Parameter | Power BI | Tableau |
QlikView/Qlik Sense |
|
Ease of Use | Easy to Moderate | Moderate to Hard | Moderate to Hard |
| Learning Curve | Moderate | Steep |
Steep (QlikView) / Moderate (Qlik Sense) |
|
Integration | Excellent (Microsoft ecosystem) | Good (third-party) | Moderate |
| Beginner-Friendly | Yes | Somewhat |
No (QlikView) / Yes (Qlik Sense) |
|
Advanced Features | Requires DAX knowledge | Extensive customization |
Strong scripting (QlikView) |
Useful Links – Introduction to Power BI | Power BI Course
Great job opportunities
Many companies are moving towards Power BI with the intention of modernizing their data analytics capabilities. It is mainly because of the easy integration with the Microsoft ecosystem and its advanced feature of visualization, which will help companies consolidate their data, gain real-time insights, and make data-driven decisions very efficiently. Such a shift generates a large demand for Power BI expertise across sectors.
Although power BI highly comes into play in different sectors of a business, some key uses include finance, sales, marketing, operations, and human resources.
- Finance and Accounting – Implementing Power BI into financial teams enable the making of reports which aid in budgeting variance analysis and forecasting. Using Power BI will keep tracking performance in comparison to targets easier. Applying Power BI keeps an organization within the regulation reporting and transparency square.
- Sales and Marketing – The Sales and Marketing department uses Power BI to track customers’ behavior, campaign results, Lead generation and the sales forecasts optimization.
- Operations and Supply Chain – Power BI makes supply chain management much easier with ingestion of insights for inventory, supplier performance, and logistics. Operation teams rely on real-time data to optimize the process of production and remove bottlenecks.
- Human Resources – HR team uses Power BI to perform analysis of employee data and track hiring trends regarding people engagement, as well as turnover rates. Using Power BI also helps in workforce planning and performance management in these organizations.
- Healthcare and Pharmaceuticals – Power BI is applied for the patient’s data analysis, tracing treatment outcomes, and resources optimization within the healthcare sector.
Below is the summary of the roles and responsibility and the indicative compensation in India.
- Entry-Level (0–2 Years):
- Salary Range: ₹3.5 Lakhs to ₹5.5 Lakhs per annum.
- Responsibilities: Creating basic reports and dashboards, connecting to data sources, and assisting in data modeling.
- Reference: AmbitionBox
- Mid-Level (3–5 Years):
- Salary Range: ₹6 Lakhs to ₹9.4 Lakhs per annum.
- Responsibilities: Designing complex dashboards, implementing DAX calculations, and optimizing report performance.
- Reference: AmbitionBox
- Senior-Level (6+ Years):
- Salary Range: ₹10 Lakhs to ₹14 Lakhs per annum.
- Responsibilities: Leading projects, mentoring junior developers, and integrating advanced analytics solutions.
- Reference: AmbitionBox
Note that salaries could vary by the location, industry, and size of the company, but generally pay more in Metropolitan places like Bengaluru, Mumbai, and Delhi.
Conclusion
If one is interested in data analytics, business intelligence, or even improving their current skill in a technology-driven marketplace then learning Power BI is definitely worth the shot. As long as the future remains bright and jobs are increasing in number, then Power BI stands guaranteed to be a good investment in professional development.


