| Key Facts | Details |
|---|---|
| Article type | 10 Power BI skills for business analysts — from hiring manager perspective |
| Primary audience | Practising BAs, BA job seekers, career switchers adding Power BI to their profile |
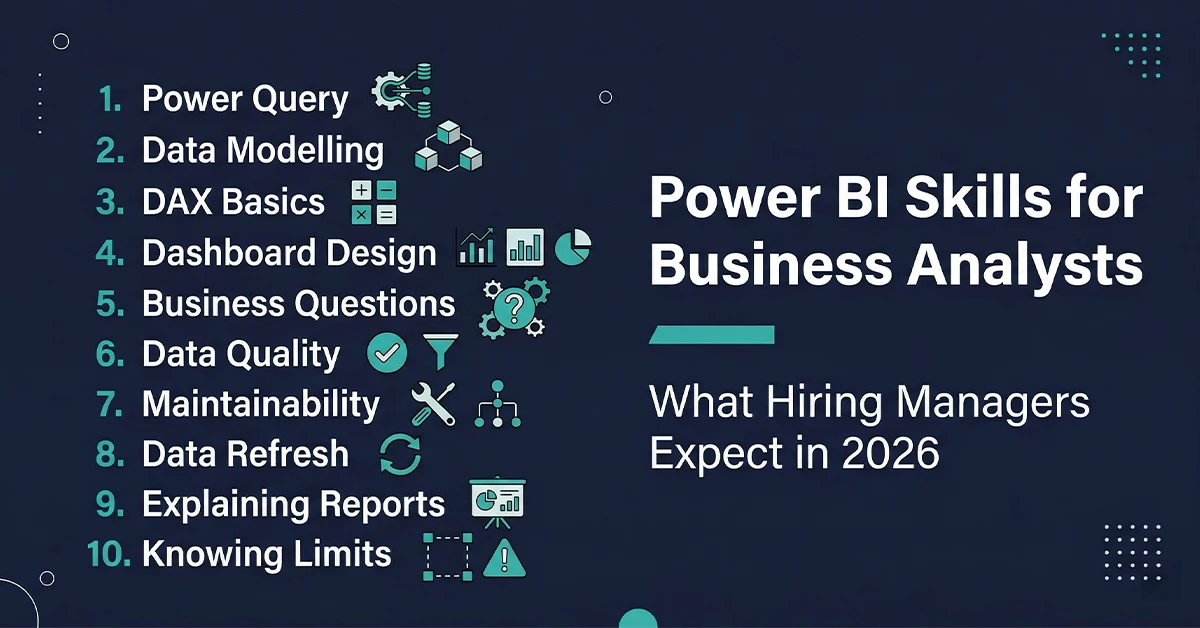
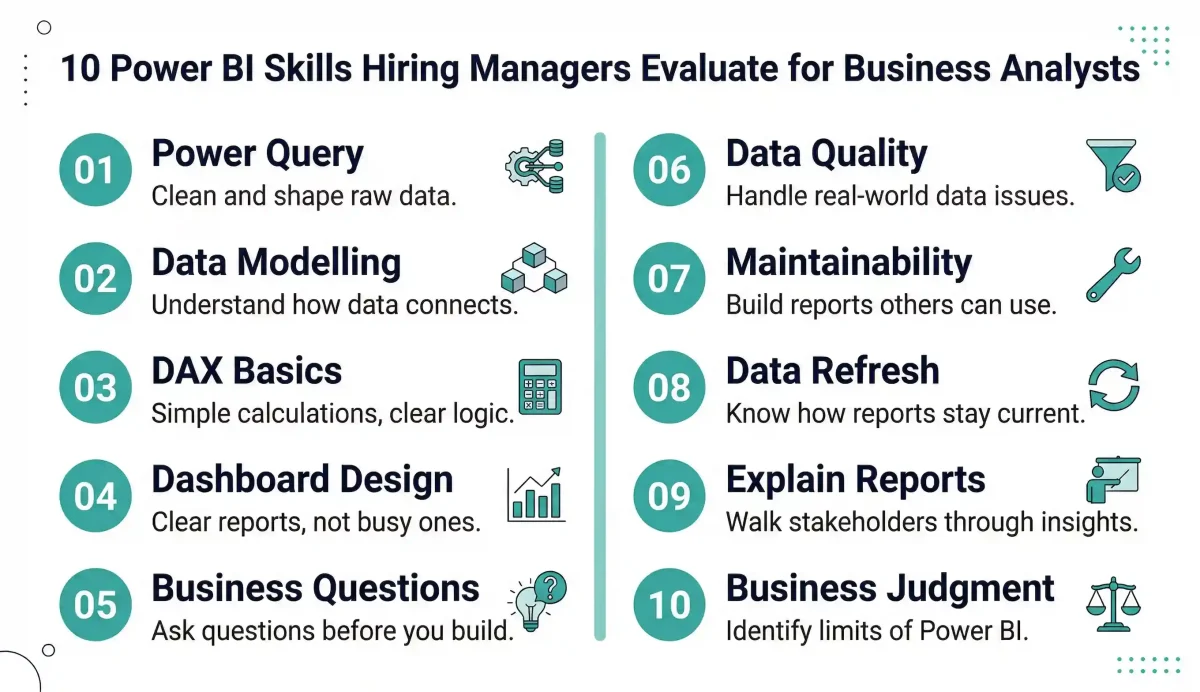
| Skills covered | Power Query, data modelling, DAX basics, dashboard design, data quality, report maintainability, data refresh, stakeholder communication, business judgment |
| Methodology | What hiring managers evaluate — practical skills over feature knowledge |
| Related certification | Microsoft PL-300 Power BI Data Analyst Associate |
| Last updated | March 2026 |
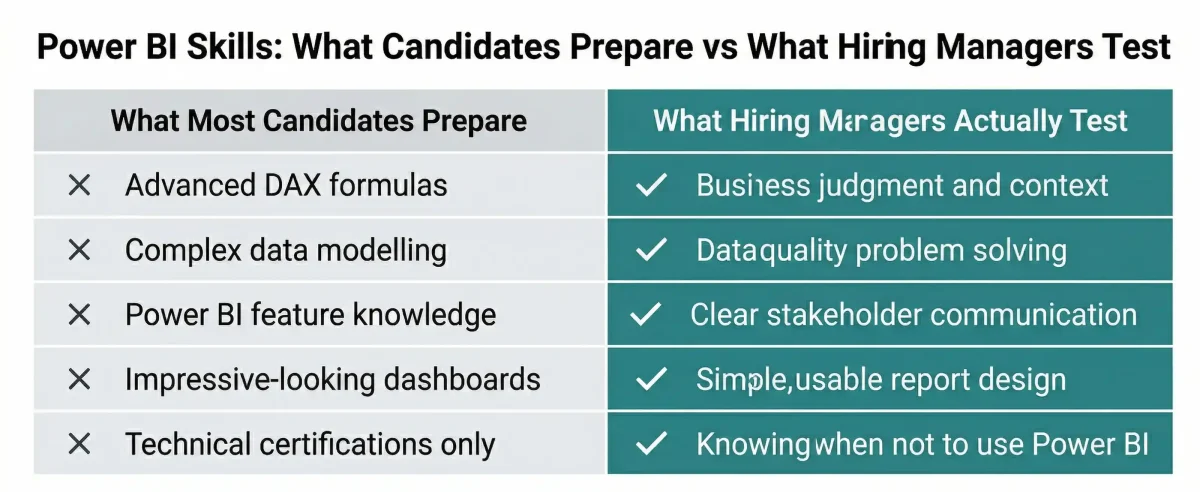
The Power BI skills for business analysts that actually matter in 2026 are not the ones most candidates prepare for. Almost every Business Analyst today lists Power BI on their resume. But when you go deeper in an interview, the gap becomes obvious very quickly.
Some know how to build reports. Some know how to think with data. Hiring managers are not looking for Power BI experts — they are looking for Business Analysts who can use Power BI practically, without overcomplicating things, without getting lost in features, and without losing sight of the business problem.
So the real question is not which Power BI tools exist. The real question is which Power BI skills actually make a difference in day-to-day work — and how hiring managers evaluate them. This guide covers all ten.
- Related: If you are starting your Power BI journey from scratch, see our Power BI Introduction guide
1. Power Query Skills — Cleaning and Shaping Raw Data
Most candidates can import data into Power BI. That is not where the real value lies, and experienced hiring managers know it immediately.
The Power BI skill that hiring managers actually evaluate at this stage is comfort with Power Query — the data preparation layer that sits between your raw data source and your finished report. Power Query is where real-world projects are won or lost. Because in real projects, data is rarely clean.
What hiring managers look for in Power Query: the ability to remove unnecessary columns, handle missing or messy values, merge or split datasets across multiple sources, rename and reformat fields for consistency, and make raw data usable for analysis — independently, without depending on a data engineer to prepare it first.
A Business Analyst who can walk into a messy Excel export, an API response, or a database query result and quickly prepare it for analysis is significantly more valuable in delivery environments than one who can only work with clean, pre-prepared data.
The underlying principle hiring managers are testing is self-sufficiency. In fast-moving projects, waiting for someone else to clean data before you can analyse it creates a bottleneck. A BA who owns the data preparation step removes that bottleneck — and that is a visible, measurable contribution to project velocity.
Practical tip for interviews: Be ready to walk through a real Power Query scenario — what the raw data looked like, what issues you found, and what steps you applied to fix them. Specific examples always outperform general statements.
- Related: For a deeper look at Power Query and data modelling fundamentals, see our Power BI Tips and Tricks guide
2. Data Modelling — Understanding How Data Connects
One of the first things interviewers check when assessing Power BI skills for business analysts is whether you understand how data connects — not in a theoretical way, but practically.
Data modelling in Power BI is the process of defining how your tables relate to each other. A correctly modelled dataset produces accurate numbers. A poorly modelled one produces numbers that look plausible but are wrong in ways that take hours to diagnose.
What hiring managers look for: Can you explain why a report is showing a certain number? Do you understand what happens when a relationship between two tables is configured incorrectly? Can you spot a many-to-many relationship that needs resolving? Can you build a basic star schema — fact tables at the centre, dimension tables connected around them?
You do not need to be a data engineer to demonstrate competence here. But you should be able to explain the structure of a report you built: what the tables are, how they connect, and why the numbers are what they are. That is what builds trust with stakeholders and with hiring managers.
The most common data modelling mistake Business Analysts make in interviews is describing what a dashboard shows without being able to explain the data structure behind it. A hiring manager who asks ‘walk me through how your report is built’ is not asking about the visuals — they are asking about the model.
3. Basic DAX Skills — Calculations Without Overcomplicating
There is a common misconception that Business Analysts need to master complex DAX to be competitive in Power BI interviews. In reality, hiring managers are looking for comfort with DAX — not complexity. Knowing when not to write a complicated calculation is as important as knowing how to write a simple one.
The DAX skills that hiring managers actually evaluate for BAs: creating basic measures for totals, percentages, and averages; handling simple time intelligence (year-to-date, month-over-month comparisons); adjusting calculation logic based on business rules communicated by stakeholders; and — critically — knowing when a simple SUM or COUNT is the right answer rather than a nested CALCULATE.
A simple, clear DAX measure that anyone on the team can read and verify is almost always better than a complex one that only the person who wrote it understands. Reports are shared tools. They are used, modified, and handed over. DAX that nobody else can follow becomes a maintenance problem.
The interview test for DAX is usually practical: ‘How would you calculate the percentage of total sales for each product category?’ or ‘How would you show sales this month compared to the same month last year?’ Being able to write these confidently — and explain the logic clearly — is sufficient for most BA roles.
What to avoid: Trying to demonstrate DAX mastery by volunteering complex formulas nobody asked for. It signals that you might build reports that look impressive but are difficult for the team to maintain.
4. Dashboard Design — Building Reports That Make Sense to Business Users
This is where many candidates with strong technical Power BI skills still fall short in practice. They build dashboards that look busy — lots of visuals, many colours, multiple charts on every page — but that do not actually help the business user make a decision.
Hiring managers evaluate dashboard design by looking at reports you have built and asking: does this answer a clear business question? Is the most important information immediately visible? Would a business user understand this without explanation?
The dashboard design principles hiring managers look for in BAs: keeping each report page focused on one business question; highlighting the most important metric prominently rather than burying it among many charts of equal visual weight; using simple, familiar chart types rather than complex or unusual visuals that require explanation; maintaining consistent formatting, spacing, and colour across all pages; and avoiding decoration that adds visual noise without adding insight.
A good Power BI report answers questions. It does not create more of them. If a business user needs you to explain every chart before they can interpret it, the report has not done its job.
The test hiring managers apply: Can you hand this report to a senior stakeholder who has never seen it before and have them understand the key message within 30 seconds? If yes, the design is working. If no, something is wrong — and it is usually too much information on one page, or the wrong visual choice for the data being shown.
Want to build Power BI dashboards that business stakeholders actually use?
Techcanvass’s Power BI Course covers dashboard design, data modelling, Power Query, and DAX — taught through real BA project scenarios, not just feature walkthroughs.
5. Asking Business Questions Before Building — The Mindset Skill
This is not a technical skill. It shows up in the quality of the reports you build and the questions you ask in an interview. It is also one of the clearest differentiators between a Business Analyst who uses Power BI and a data analyst who uses Power BI.
The questions hiring managers expect a strong BA to ask before building any dashboard: What business decision will this dashboard support? Who is the primary audience and what do they already know about the data? How often will this report be used — daily, weekly, or occasionally for a specific review? What action will the user take based on what they see? What does success look like for this report?
These questions are not obstacles to getting started. They are what ensure that the work you do is the right work. A Business Analyst who dives straight into building without asking them often ends up rebuilding the report two weeks later when the stakeholder says ‘this is not quite what I meant.’
Power BI is not about building dashboards. It is about solving business problems using data. The dashboard is the output — the business problem is the brief. Hiring managers notice when a candidate treats the tool as the starting point rather than the business question.
In interviews: When asked about a Power BI project you worked on, always start with the business context — what problem the report was solving, who needed it, and what they did with it. Then describe the technical approach. This framing immediately signals the business analyst mindset that hiring managers are looking for.
6. Handling Real-World Data Issues — Working With Imperfect Data
In interviews, data scenarios often sound clean. In real projects, they almost never are. Handling real-world data quality issues is one of the Power BI skills that separates candidates with project experience from those with only training course experience.
The data quality issues Business Analysts encounter in real Power BI projects: missing values that need to be handled without distorting calculations; duplicate records that cause metrics to double-count; inconsistent formats across data sources — dates formatted differently, text fields with inconsistent capitalisation, numeric fields stored as text; delayed or missing data refreshes that leave stakeholders working from stale information.
Hiring managers are not looking for perfect solutions to these problems. They are looking for evidence that you can identify data quality issues quickly, work around them using Power Query or DAX logic, and communicate the limitations clearly to stakeholders so decisions are made with appropriate context.
The worst response to a data quality issue in a real project — or in an interview — is to either miss it entirely or to present outputs that include the issue without disclosing it. The best response is to identify it, quantify the impact, apply a documented workaround, and flag the limitation so stakeholders know what they are working with.
What hiring managers want to hear: a specific example of a data quality issue you encountered, what you found, what you did about it, and what you told stakeholders. Candidates who can describe real data problems in detail are far more credible than those who describe only clean scenarios.
- Related: For a detailed breakdown of Power BI’s data transformation capabilities, see our guide to Power BI Semantic Model and connection modes.
7. Report Maintainability — Building Reports Others Can Use and Update
Anyone can build a Power BI report once. The more important question is whether someone else can understand it, update it, and maintain it after you hand it over. Hiring managers care about report maintainability more than most candidates realise — because poorly built reports become long-term problems for the team.
What maintainability means in practice: giving measures and calculated columns clear, descriptive names rather than defaults like ‘Measure 1’ or ‘Column (2)’; organising measures into folders within the model so the report is navigable; keeping DAX logic readable and adding comments where complex logic is unavoidable; avoiding unnecessary complexity — if the same result can be achieved with a simpler formula, use the simpler one; and structuring report pages with a clear, consistent layout that new users can follow without a guide.
Reports are team assets, not individual achievements. They get handed over when projects end, when team members change, or when reports are promoted from prototype to production use. A report that only its creator can navigate is a liability.
In an interview, demonstrating awareness of maintainability is a strong signal of professional maturity. It shows that you think about the lifecycle of your work — not just the initial build, but the ongoing use and evolution of the report over time.
A simple test: If you handed your report to a colleague who has never seen it before and asked them to add a new measure next month, could they do it without calling you? If yes, the report is maintainable. If no, something needs simplifying.
8. Understanding Data Refresh and Report Sharing
A Power BI report is only useful if the data it shows is current and if the right people can access it. Understanding how data refresh and report sharing work in Power BI is a practical expectation for Business Analysts — not an advanced technical skill, but a professional baseline.
The data refresh and sharing knowledge hiring managers expect from BAs: understanding the difference between Power BI Desktop (local files) and Power BI Service (cloud-based sharing); knowing how scheduled refresh works and how often a report’s data can be refreshed on different licence tiers; understanding how workspaces organise reports and how access is controlled; and knowing how reports are shared — whether through direct sharing, workspace access, publishing to apps, or embedding in other tools like Teams or SharePoint.
You do not need to be a Power BI administrator. But you should be able to answer when a stakeholder asks ‘when was this data last updated?’ and ‘who else has access to this report?’ — and you should have set up these answers correctly when you built and published the report.
Basic awareness of the data refresh cycle also matters for managing stakeholder expectations. If a dashboard refreshes daily at 6am and a stakeholder checks it at 5am, they will see yesterday’s data. Knowing this — and communicating it clearly — prevents confusion and builds trust in the report’s reliability.
9. Explaining Your Power BI Reports — The Communication Skill That Decides Interviews
This is often where Power BI interviews are actually decided. Hiring managers do not just look at what you built. They ask: ‘Walk me through your dashboard.’ And they evaluate far more than technical capability in that moment.
What hiring managers are assessing when they ask you to explain a report: How do you frame the business problem before showing the solution? Can you explain why you chose a particular visual rather than an alternative? What is the story the data is telling, and do you lead with that story or with the chart? Can you anticipate the questions a stakeholder would ask when looking at this report and pre-address them in your explanation?
A Business Analyst who can explain a Power BI report clearly — connecting every visual to a business question and every number to a business implication — always stands out more than one who built something technically correct but cannot articulate why they built it that way.
The explanation matters because it is a proxy for how you will communicate with stakeholders in the actual role. If you struggle to explain your report in an interview setting, hiring managers reasonably conclude that you will also struggle to explain it in a stakeholder presentation, a steering committee review, or a business user training session.
How to structure a report walkthrough: Start with the business context — what question this report answers and who uses it. Then describe what the user sees first and why. Then walk through the key metrics and what they mean. Then describe any filters or interactivity and how they support different user needs. Finish with what action the report enables. This structure works in interviews and in actual stakeholder sessions.
10. Knowing When Power BI Is Not the Right Tool
This may sound unexpected, but it is one of the Power BI skills that hiring managers genuinely respect — and that most candidates never mention because they assume they should always be advocating for the tool.
Not every business problem needs a Power BI dashboard. Knowing when a different approach is more appropriate is a sign of professional judgment, not a gap in your Power BI skills.
Situations where Power BI may not be the right answer: when a business question can be answered with a single Excel table that a stakeholder can filter themselves; when the underlying problem is a process issue rather than a data visibility issue — building a dashboard does not fix a broken process; when the data is not reliable enough to drive decisions and the right action is improving data quality rather than visualising unreliable numbers; and when the stakeholder needs a one-time analysis for a specific decision rather than an ongoing monitoring tool.
Hiring managers respect this judgment because it demonstrates that you understand Power BI as a means to an end — not as the end itself. The goal is always the business outcome. Power BI is one of the tools that can help you get there. It is not always the right one.
Business Analysts who recommend simpler solutions when simpler solutions are appropriate are more trusted than those who reach for the most complex tool in every situation. That trust compounds over time and directly influences career progression.
What Hiring Managers Are Really Testing in Power BI Interviews
When you step back, the pattern becomes clear. Hiring managers are not testing whether you know Power BI features. They are testing whether you can use Power BI with business judgment.
| What They Ask | What They Are Actually Testing |
|---|---|
| ‘Walk me through your dashboard’ | Business communication, stakeholder thinking, ability to explain data in context |
| ‘How did you handle the data quality issue in this report?’ | Real-world problem solving, transparency with stakeholders, data preparation skill |
| ‘Why did you choose this chart type?’ | Dashboard design judgment, understanding of user needs, visual communication skill |
| ‘What would you have done differently?’ | Self-awareness, continuous improvement mindset, professional maturity |
| ‘When would you NOT use Power BI for this?’ | Business judgment, ability to recommend the right tool for the right problem |
| ‘How does this report get updated?’ | Understanding of the full Power BI workflow from build to publish to maintenance |
They are looking for someone who understands the business context, works comfortably with imperfect data, builds clear and usable reports, and communicates insights effectively. The tool is just the medium. The business thinking is what gets you hired.
Ready to build the Power BI skills hiring managers are looking for?
Techcanvass’s Power BI Analyst Track is designed for Business Analysts who want to move beyond basic report building to genuine data analysis competency — covering Power Query, DAX, data modelling, and dashboard design through real BA project scenarios.
Frequently Asked Questions: Power BI Skills for Business Analysts
A business analyst needs: data cleaning using Power Query, basic data modelling, foundational DAX calculations (totals, percentages), and clear dashboard design. Beyond technical skills, handling real-world data quality issues and explaining insights clearly to stakeholders are crucial.
Hiring managers look for practical competency — the ability to use Power BI to answer real business questions without overcomplicating the solution.
Yes — Power Query is essential. It is the data preparation layer where raw, messy data is cleaned and shaped for analysis. A BA who can use Power Query independently — handling missing values or merging datasets — can work self-sufficiently without depending on data engineers, which significantly reduces project delays.
BAs need a working knowledge of basic DAX, not advanced expertise. Focus on creating simple measures for totals, counts, percentages, and basic time intelligence (like month-over-month comparisons). Knowing when NOT to write a complex formula is equally valued, as simple, maintainable measures are usually better for team collaboration.
Data analysts focus on technical depth, performance optimisation, and enterprise deployment. Business analysts use Power BI as a communication tool to validate requirements and track project KPIs. For a BA, the starting point is always a business question rather than just exploring a dataset.
Evaluation is done through portfolio reviews and structured questions. They often ask you to walk through a dashboard, assessing how you connect visuals to business problems, how you handled data quality issues, and whether your design choices reflect actual user needs.
Project-based practice is most effective. Work with realistic business datasets to answer actual business questions. Master Power Query and basic modelling first, then move to dashboard design. Getting feedback from a business user perspective is more valuable than just producing predetermined outputs from tutorials.
The Microsoft PL-300 (Power BI Data Analyst Associate) certification is highly recommended. It validates practical skills and is increasingly requested in BA job descriptions. The study process itself provides a comprehensive curriculum that helps standardise your knowledge at a professional level.
Juniors focus on fundamentals: connecting data and building standard reports. Seniors demonstrate stronger data modelling judgment, use DAX for complex calculations, and design reports for multiple stakeholder groups. Seniors are also evaluated on their ability to explain insights to executive audiences and evaluate business impact.
In This Article
