What Is Data Visualization? Data visualization is an essential step in the analytics life cycle, allowing us to interpret and communicate data insights visually. Before we dive into this topic, let’s check the sales and profit data across different regions for various products.
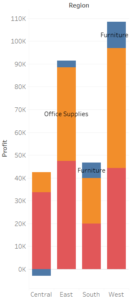
Looking at the data for table ‘Sample – Superstore,’ can you answer this question: “Which region has the highest profit for Technology and the lowest profit for Furniture”?
Using just numbers from the data set, getting to the correct answer is very daunting.
For instance, answering this question using a visual would be relatively easy and give us the correct answer. What Is Data Visualization? It refers to the graphical representation of data to help us understand complex information quickly. (This was created using Tableau.) Visually, we also understand the profit variation across regions by looking at the graph.
Take your analysis to the next level by seeing How do you use Data Visualization in Tableau.

A large amount of abstract information from excel is also displayed in this graph. Still, we can easily and quickly grasp it because the brain processes visualizations at a much faster speed. When we look at visuals, it holds our attention longer, and we process much more information than raw text. Our brains can process data much faster using colors and known patterns in order to draw accurate data insights and trends.
Useful Link – CBDA Certification Training Course
What Is True About Data Visualization?
Terabytes and petabytes of data are generated every day, and analyzing this data to uncover valuable insights is essential. But can you imagine scrolling through such a massive amount of data to find trends and patterns? What Is Data Visualization, and how does it help? With the overwhelming volume and rate at which data is growing, visual tools are essential to make sense of it all. Every data set has a story to tell, but we need practical visualization tools to discover and communicate that story’s purpose to stakeholders effectively.
Visualization refers to techniques that help us graphically visualize data to find out trends, communicate insights and understand complex relationships between variables.
Why Is Data Visualization Important?
- Quick and Easy: Visuals communicate easy-to-understand information precisely.
- Accurate Insights: As we saw in the above example, visuals give us accurate insights from the data. It helps us form correct decisions.
- Faster Decision Making: Visuals help us to look at a massive amount of data in a small space, map relationships across variables, identify patterns, highlight outliers, and much more which, leads to faster and accurate decisions than scanning rows and rows of data.
- Dynamic Updates: Instead of creating more and more charts and graphs, we can dynamically change the data selected and see how it changes the graphs by making the visual interactive.
- Spotting Errors: Visuals help identify errors in the data that can be removed to get the right visuals.
- Drill up and Drill down: It gives users the control to look at the overall picture by drilling up or go deeper and explore by drilling down.
- Applicable Across Various Sectors: Visuals provide valuable inputs in many different fields: business, crime management, healthcare, education, public sector, and many more.
How To Create Good Charts?
- The visual must be clear, simple, intuitive, aesthetic, and should highlight patterns.
- Use metrics that businesses can understand.
- Understand the business goal: Once the business questions we are trying to answer using the visuals are clear. we can create correct graphs displaying the right trends to answer the questions.
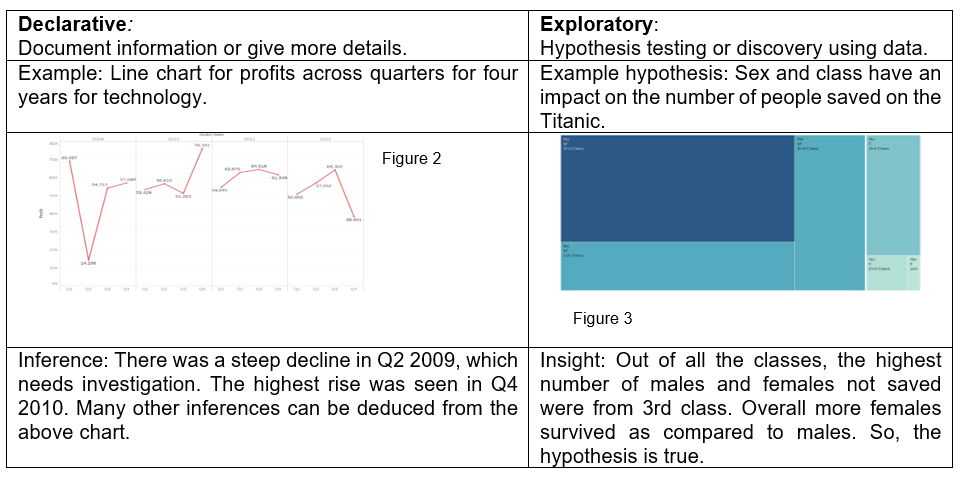
- Identify the visual: declarative or exploratory.

5. Choose a compelling visual: Once we know the goal, choosing the correct chart or graph is the key to display information from data accurately.
Examples of Data Visualization in Action:
- Line Chart: It views data trends over time, as sales over the past few years, as shown in Figure 2.
- Bar Chart: It compares data across categories like the popularity of books based on the number of books read or the chart in Figure 1.


3. Eliminate Unwanted Parts: Reduce the font size, arrange or remove labels and borders. It shortens names on axes, remove extra colors, and fine-tune other aesthetic factors.
4. Focus on the Correct Part: By choosing the required variables only, focus on the question you want to answer. It shows using a visualization. Remove extra variables.
5. Form a Compelling Story: A story is a sequence of visualizations that work together to convey information. An exciting story should tell a data narrative, provide context, demonstrate how decisions relate to outcomes and make a compelling case.
To summarize, data visualization forms an integral part of the analytics life cycle. It enables -a business to identify trends and patterns and use data to benefit the company.
Conclusion
What Is Data Visualization? It’s a powerful tool for revealing stories buried in data, going beyond simply creating attractive charts and graphs. Data visualization converts complex information into a universally understandable visual language, making it essential for decision-makers across industries. By utilizing the art and science of data visualization, we enhance communication, uncover new insights, and make well-informed decisions, all while improving our ability to interpret data effectively
With our CBDA Certification Training Course, which offers a wide variety of learning tools, you can unleash the potential of data. Through fascinating video lectures and presentations from knowledgeable trainers, delve deeply into the subject. With over 500 practice questions and four full-length practice tests, test your knowledge while getting real-world applications from a range of case studies. In addition to interactive flashcards and match-making exercises for reinforced learning, our special method includes mind maps and crossword puzzles to help with idea recall. Utilize our cutting-edge training to accelerate your career while embracing the data revolution.


