power bi copilot

Power BI Copilot vs. Manual Reporting: Will AI Replace Data Analysts in 2026?

Last Updated on January 30, 2026 by Techcanvass Academy

Listen to this article as a podcast

0:00 / 0:00
Table of Contents

It’s Friday at 4:00 PM. You’re ready to wrap up for the week when an urgent email hits your inbox. A key stakeholder needs a last-minute change to the quarterly sales report. Specifically, they want a “Year-over-Year growth comparison by product category, filtered by the latest promotional campaign.”

In the pre-AI era, this meant a long evening of troubleshooting complex DAX measures, adjusting filter contexts, and manually updating text boxes to explain the trends. Your weekend was officially on hold.

This is where Power BI Copilot steps in.

With Microsoft’s AI-powered assistant, that same task can now start with a simple natural language prompt. As AI integration moves fast within Microsoft Fabric, a lot of data pros are getting nervous. The question on everyone’s mind is: Will AI replace data analysts?

The short answer? No. But the reality is a bit more complex. Manual reporting is on its way out, but high-level data analysis is just getting started. This article looks at the shift from “Manual Hell” to the Copilot workflow and why your human expertise is more valuable now than ever.

AI won’t replace Data Analysts. Data Analysts using AI will replace those who don’t.

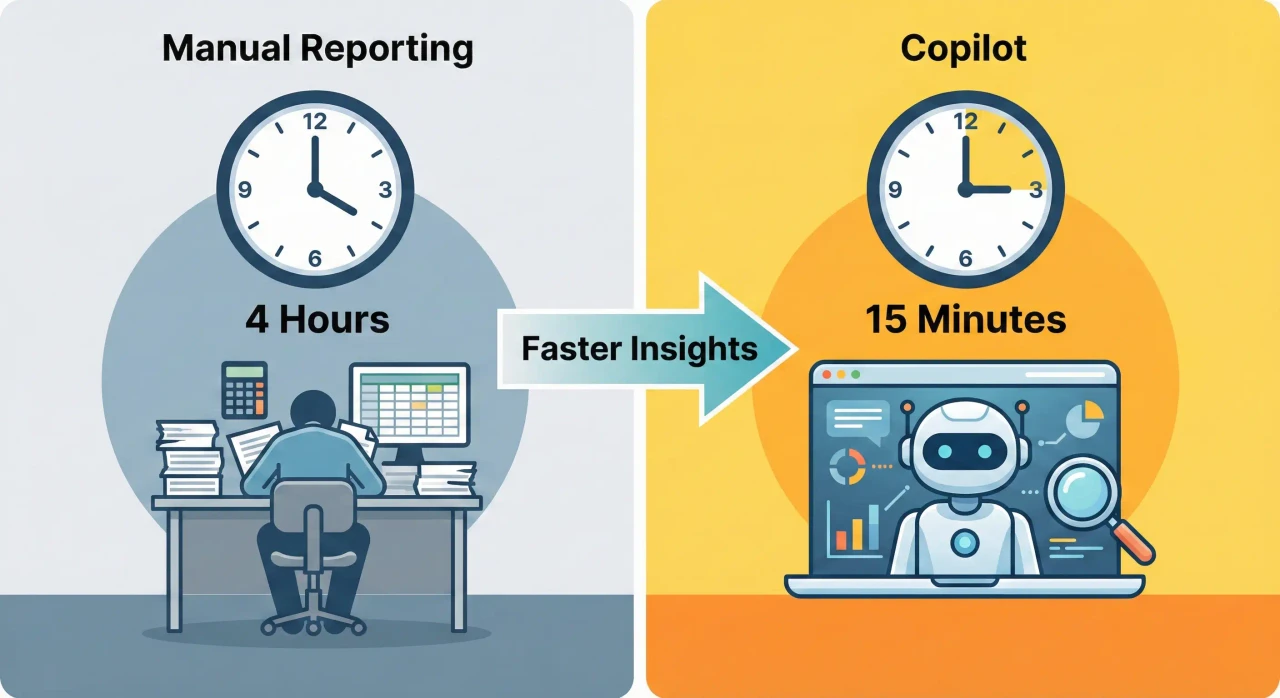
The “Manual Hell” vs. The Copilot Workflow

For years, the life of a BI developer was defined by the “grunt work” of report building. Workplace studies show that analyst productivity can increase by up to 40% when using AI tools like Copilot, mostly by cutting out repetitive tasks.

But relying on AI needs a solid base. You cannot effectively direct an AI assistant if you don’t understand the underlying structure of your data. This is why mastering data modeling foundations is what separates junior developers from senior analysts.

Quarterly_Sales_Report_FINAL_v2.xlsx – Excel
Old way of manual reporting showing messy desk and spreadsheets
The “Manual Hell”: Hours spent on repetitive tasks before AI.

Let’s look at how the workflow is changing:

Feature The Old Way (Manual Reporting) The New Way (Power BI Copilot)
DAX Creation Browsing forums, debugging syntax, and testing complex logic for hours. Typing “Create a measure for YOY growth” and reviewing the generated code.
Visual Creation Manually dragging fields, formatting axes, and picking color palettes. Asking Copilot to “Create a page that summarizes sales performance.”
Data Summarization Manually writing an “Executive Summary” based on your own observations. Using the “Narrative” visual to generate automated, dynamic text insights.
Data Cleansing Writing dozens of Power Query steps to fix naming inconsistencies. Using AI-suggested transformations to reshape data instantly.

Top 3 Features of Power BI Copilot That Save You 10+ Hours a Week

The Power BI Copilot feature set isn’t just a “chatbot”. It is a productivity engine integrated directly into your workspace via Microsoft Fabric Copilot. Here are the features currently changing the game:

1. Instant DAX Generation

The most time-consuming part of Power BI has always been DAX (Data Analysis Expressions). Whether it is CALCULATE, FILTER, or ALLSELECTED, one misplaced comma can break a report.

How Copilot Helps: You can now describe the calculation you need in plain English. For example, typing “Calculate the rolling 3-month average of Total Sales” into the DAX query view prompts Copilot to write the correct code, explain the logic, and allow you to add it to your model with one click. It acts like a pair programmer, handling the syntax so you can focus on the business logic.

DAX Query View – Power BI Desktop
Power BI Copilot DAX Generation Interface showing natural language input
Figure 1: Copilot generating DAX from plain English.

2. Smart Narrative Summaries

Stakeholders often look at a beautiful dashboard and ask, “So, what does this actually tell me?” Previously, analysts had to manually write text boxes explaining that “Sales increased by 10% due to X.” If the data refreshed, that text box became outdated instantly.

How Copilot Helps: The new Narrative visual automatically analyzes your data and generates a text summary of the key trends, outliers, and anomalies. It updates dynamically as the data changes. You can even adjust the tone (e.g., “Make it professional” or “Make it concise”) and the focus (e.g., “Focus on the decline in the Europe region”).

Sales Report – Power BI Desktop
Power BI Smart Narrative Visual creating automated summaries
Figure 2: Smart Narrative automatically summarizing trends.

3. Synonyms & Q&A (Democratizing Data)

One of the biggest drains on an analyst’s time is answering ad-hoc questions like, “What were sales in Q3?” or “Show me the top 5 customers.”

How Copilot Helps: By upgrading the Q&A visual with AI, Copilot allows non-technical users to ask these questions themselves. It uses advanced synonym matching to understand that when a boss asks for “revenue,” they mean the “Total Sales” measure. This feature effectively builds a self-service bridge, freeing you from being a “report factory.”

Q&A Setup – Power BI Desktop
Power BI Q&A Setup screen showing synonyms feature
Figure 3: Teaching Copilot business vocabulary via Synonyms.

What Copilot Can’t Do (The “Human” Value)

If Copilot can write DAX and build charts, what is left for you? This is usually where the fear comes from. However, AI has significant blind spots that require human intervention.

1. Understanding Business Context

Copilot is a mathematical engine, not a business strategist. It can tell you that sales dropped by 15% in March, but it cannot tell you why. Was there a supply chain strike? Did a competitor launch a new product? Did the marketing budget get cut?

Connecting data anomalies to real-world events requires understanding business requirements and maintaining relationships with stakeholders. An AI cannot interview a Sales Director to understand the nuance of a failed campaign. Only a skilled analyst can bridge that gap.

2. Managing Stakeholders

Data reporting is often 20% technical and 80% political. A stakeholder might demand a specific (and perhaps misleading) visualization because “that’s how we’ve always done it.” Copilot cannot negotiate, persuade, or educate a stubborn manager. It takes human soft skills to drive data literacy and convince leadership to adopt best practices.

3. Data Modeling & Architecture (Garbage In, Garbage Out)

This is the most critical point: Copilot is useless on bad data. If your data model is a mess, full of many-to-many relationships, circular dependencies, or duplicate tables, Copilot will generate incorrect or hallucinated answers. AI thrives on a clean Star Schema. The role of the analyst is shifting from “Dashboard Builder” to “Data Architect,” ensuring the foundation is clean enough for AI to function correctly.

Lineage View – Microsoft Fabric
Power BI Lineage View showing complex data dependencies
Figure 4: Visualizing complex backend data flows that Copilot cannot fix.

The Verdict: Evolution, Not the End

It is a lot like when Excel came out. When spreadsheets arrived, they didn’t replace accountants. They replaced the need for accountants to do mental arithmetic, allowing them to focus on financial strategy.

Similarly, Power BI Copilot is replacing the “Report Builder” but elevating the “Data Storyteller.”

  • Yesterday’s Analyst: Spent 30 hours building the report, 10 hours cleaning data, and 0 hours analyzing it.
  • Tomorrow’s Analyst: Spends 5 hours guiding Copilot to build the report, 10 hours architecting the data model, and 25 hours driving business decisions based on the insights.

The market is already reflecting this. Salaries for analysts who can demonstrate “AI Literacy” and the ability to deploy Microsoft Fabric solutions are rising, while demand for “pure” reporting roles is flattening.

Conclusion

It is normal to worry that AI will replace data analysts, but you don’t need to. Power BI Copilot is not your replacement. It is your exoskeleton. It lifts the heavy burden of manual coding and formatting, leaving you free to do the work that actually gets you promoted: thinking, strategizing, and solving business problems.

The only analysts at risk are those who refuse to adapt.

Don’t let the technology outpace you. To stay relevant in 2026, you must master both the fundamentals of clean data architecture and the advanced capabilities of AI. Start your journey today with Techcanvass’s Power BI Course, designed to turn you into the strategic, AI-empowered analyst the future demands.

Frequently Asked Questions

Will Power BI Copilot replace data analysts?
No, it acts as an exoskeleton to handle repetitive tasks like coding and formatting, allowing analysts to focus on high-value strategy and stakeholder management.
Can Copilot write complex DAX formulas for me?
Yes, you can describe calculations in plain English, and Copilot acts as a “pair programmer” to generate the correct syntax and explain the logic instantly.
Does Copilot work if my data structure is messy?
No, AI follows the “Garbage In, Garbage Out” rule, so human expertise in building clean Data Models and Star Schemas is more critical than ever.
How does the Smart Narrative feature help with reporting?
It automatically writes dynamic text summaries of your data’s trends and outliers, saving you from manually updating text boxes every time the data refreshes.
Can Copilot answer questions from non-technical managers?
Yes, the enhanced Q&A visual allows stakeholders to ask questions using everyday language (e.g., “Show sales by region”), provided you map the synonyms correctly.
Will I still need to learn data modeling if I have Copilot?
Absolutely, because Copilot cannot fix architectural errors or understand business context; it relies entirely on the quality of the foundation you build.
Is Power BI Copilot free to use?
Copilot features are generally part of the Microsoft Fabric ecosystem and typically require specific F-SKU or P-SKU capacity configurations to run.

Leave a Reply

Your email address will not be published. Required fields are marked *

Fill out this field
Fill out this field
Please enter a valid email address.
You need to agree with the terms to proceed

Menu